Natural language processing (NLP) for analysing job postings
Zaragoza. First Edition. 2022 The labor market that we all know is developed on a scheme like two large notice boards, one facing the other: the first with those offering jobs and the…
A learning project shared by the community. The article documents its team, methods and results; it does not establish that the prototype is ready for real-world use.

This archive includes automatic translations. Audio, video and text inside images remain in their original language.
Zaragoza. First Edition. 2022
The labor market that we all know is developed on a scheme like two large notice boards, one facing the other: the first with those who offer jobs and the second with those who demand them. And in many cases it is the second that adapts to the first.
But we believe this has to change. Rather than a meeting in which most of the time it is chosen by elimination, work relationships should be a little more similar to personal ones, at least in their initial approaches. In contact apps, we have to provide a lot of information about who we are and also what we are looking for. From there candidates arise and with that the search is made for MATCH by both parties.
It is not a matter of falling in love at first sight, but we do believe that it is good to know more in depth what job offers consist of. These are public data that can tell us very important aspects of both the company and the territory where they are located. The requirements they ask of their future workers and their analysis can help both job seekers, the education sector, and governments and institutions in predicting situations of deficit or surplus in any of them. In an interdependent and globalized economy like the one we live in, offering excellent labor flow behavior can help establish companies, and be a good support for the economy and decision making.
In the case of Aragon, the situation is complicated in places like Teruel, when the depopulation factor is applied in many areas. Insisting on the same idea as the objective of our work, the Minister of the Presidency of Aragon, Mayte Pérez, in a meeting in Teruel commented a few days ago the importance of generating "forums and synergies to anticipate the employment needs that are going to arise. We must analyze the labor market today, but also see the future expectations that the province has to accompany them with a qualified training offer" [1].
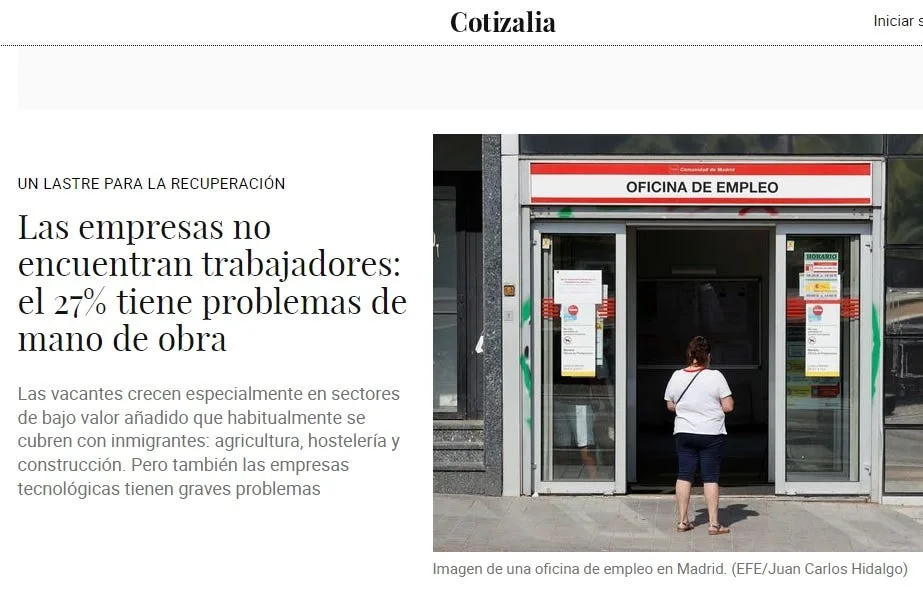
Figure 1: Elconfidencial.com 12/15/2021.
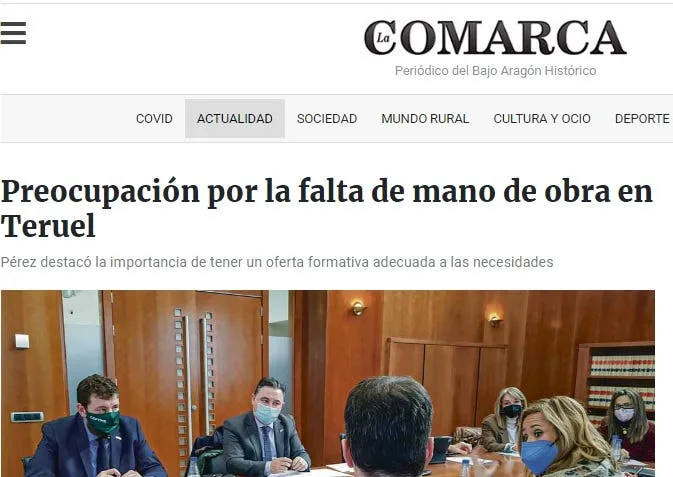
Figure 2: The Region 01/27/2022.
Construction companies, both public and civil works, already warned in autumn of the lack of labor for their sector, which could cause problems.
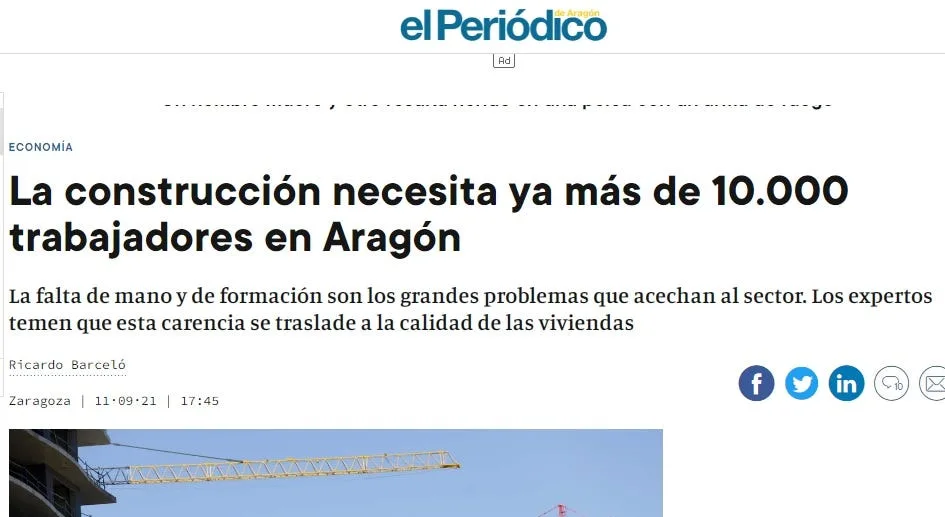
Figure 3: El Periódico de Aragón 09/11/2021.
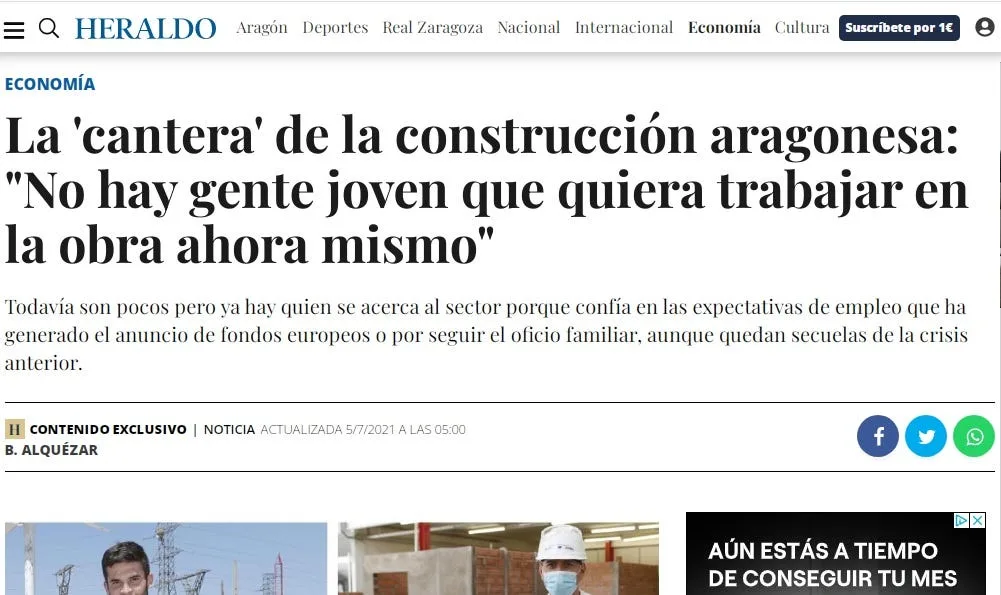
Figure 4: Herald of Aragon 07/05/2021.
And not just the construction.
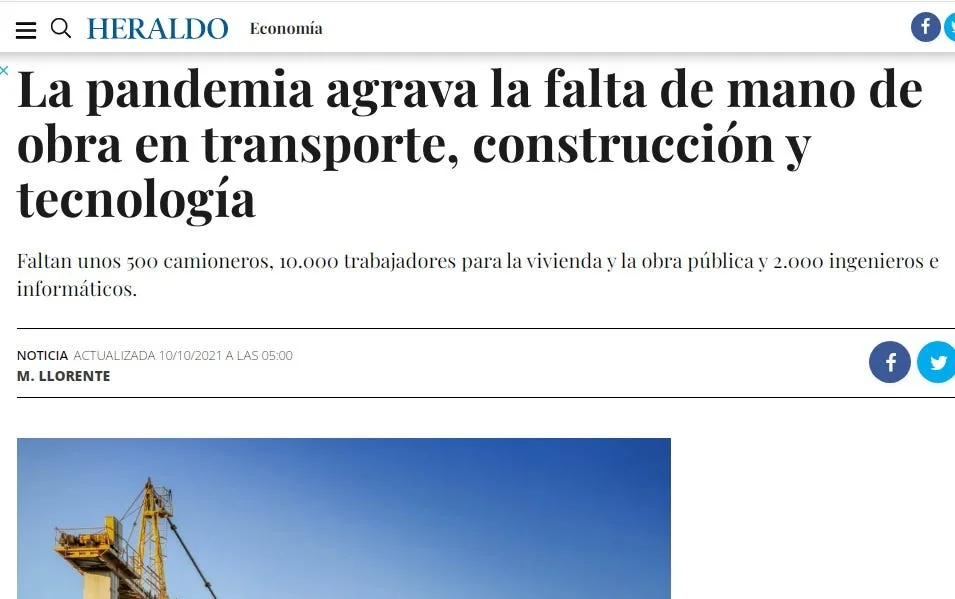
Figure 5: Herald of Aragon 10/10/2021.
Losses due to the lack of labor in Europe are already estimated at 30 billion euros annually [2].
Faced with these data, those of unemployment. In Aragon there are more than 61,000 unemployed people. The majority, more than 42,000, are from the service sector. But in the construction sector there are 3,871 unemployed workers, 7,000 in industry and 3,624 in agriculture and livestock. Added to all of them are more than 4,500 people without previous employment.
Why is there unemployment in a sector when there is more demand? Do the people who are unemployed in that sector not meet the requirements? Do they not access the offers because they are not in the same population in which they are published?
Many questions are raised, and many more when companies and institutions plan their activity for the next ten years, to recover from the break caused by COVID and already mark the labor needs they will have.
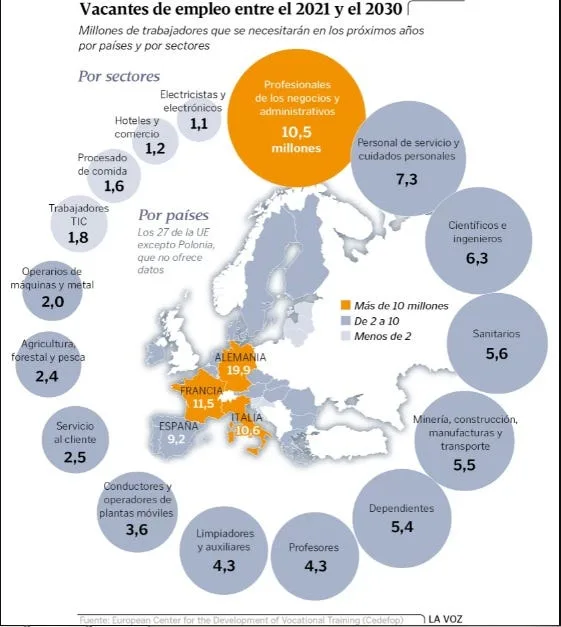
Figure 6: The Voice of Galicia 10/16/2021.
Problem
We focus on the following problem: How could we facilitate the analysis of job offers in Aragon to provide its citizens with relevant conclusions? How can we help companies find labor that fits their needs? Can institutions plan employment supply and demand by knowing much more about the labor market?
Both the identified problem and the developed project are framed in the SDG 8 (Sustainable Development Goal) decent work and economic growth [3], and is motivated by the lack of tools that make it easier for Aragonese to study in global terms the current situation of job offers in Aragon.
General objective
To solve the identified problem we consider ourselves as general objective: Develop a tool based on Natural Language Processing techniques that makes it easier to analyze the job offers available in Aragon based on different criteria (sector, province, city, INAEM office, dates, etc.). Its usefulness may be of interest to companies, institutions, educational planning, students, unemployed, training companies, etc...
In order to meet the stated objective and carry out the project in an organized manner, we follow the CRISP-DM methodology (Cross-Industry Standard Process for Data Mining) [4], aimed at Data Mining work, which in our case focuses specifically on basic Natural Language Processing (NLP) techniques [11]. The following figure presents the different phases covered by the methodology.
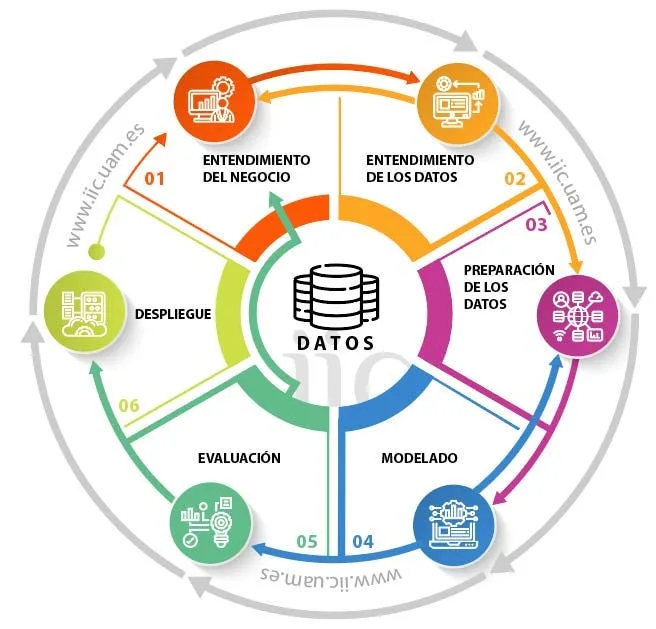
Figure 7: CRISP-DM methodology (scheme from https://www.iic.uam.es/innovacion/metodologia-crisp-dm-ciencia-de-datos)
Data set
When beginning the approach of our proposal, we considered studying the entire employment environment in Aragon, supply and demand. For the offer We saw that we could count on the Aragonese Employment Institute, INAEM [5], which from Monday to Friday provides a PDF with the job offers available that day throughout the territory, distributed in 28 productive sectors.
We also considered using Infojobs, but the information provided there is not as well classified. In addition, Infojobs provides certain types of work. They are not usually jobs with high training and high salaries, which would bias the characteristics of the study.
For the demand We think about LinkedIn, which does offer a lot of information and good indexing. But not all members of the LinkedIn community are looking for jobs. With which it was ruled out. The same thing happened with job seekers on Infojobs or other similar pages such as Milanuncios.com. They tend to be profiles with an urgency to work, which would be suitable for another study, perhaps of a social nature, but not along the lines that we propose.
For this reason, we decided to go to the base, and create a system capable of interpreting the daily offer of jobs in the autonomous community of Aragón, and try to get the most out of the card model with the basic data that we find in each of the jobs that are advertised there. It must also be taken into account that INAEM manages a good part of the jobs that enter the labor market in Aragon, but not 100%. Therefore, our conclusions cannot in any case be closely adjusted to reality, but rather become trends, approximations and evolutions close to the real job offer.
The data set that was obtained was the result of analyzing, extracting and preprocessing a set of those PDF documents available on the INAEM portal [5], and also incorporating the information that appears on the INAEM website itself, in the date range from 2021 to early March 2022. In total 1152 job offers. They are distributed by professional sectors in Aragón (see Figure 8). Each job offer is divided into two blocks. A shorter and more schematic one with the title, province, city, code, publication date and office. The second block is the description. Within it, information is obtained about the tasks to be performed, requirements requested by the company, working conditions, procedures and deadlines, among others.
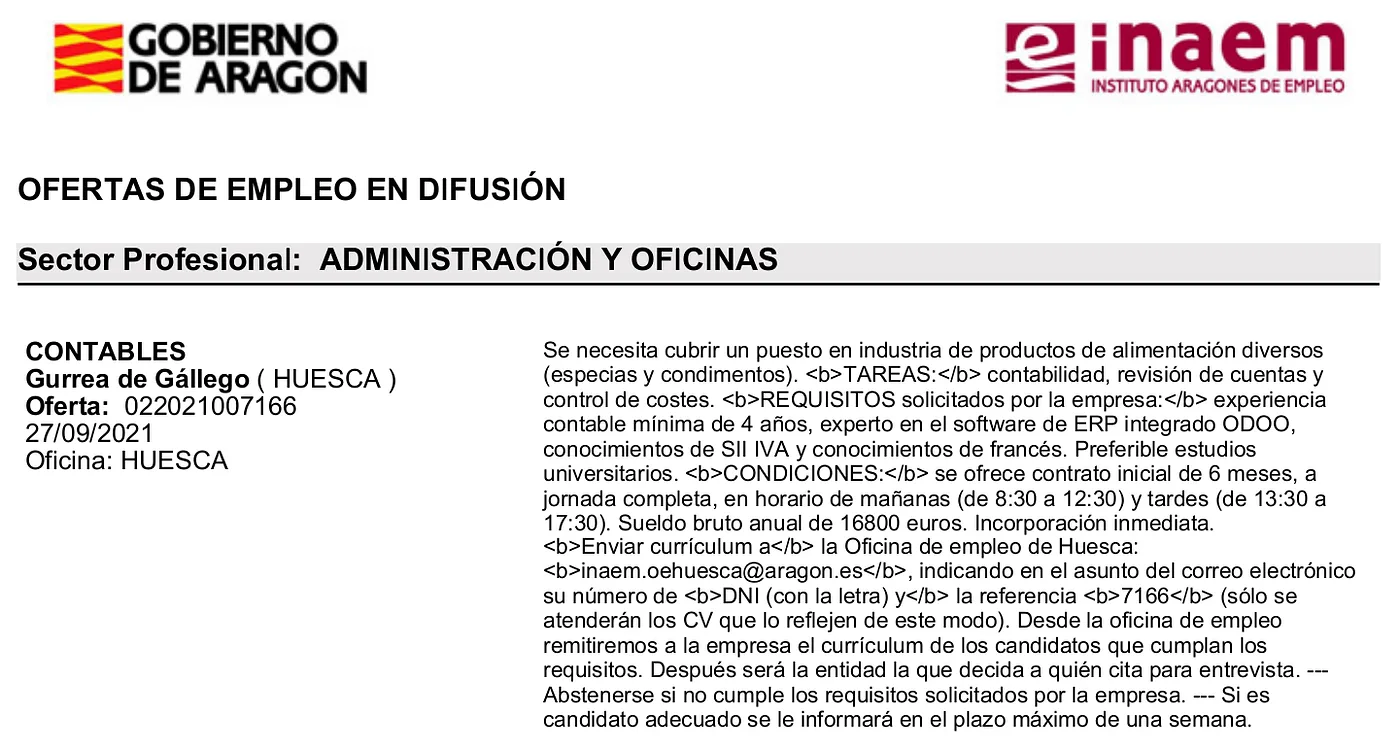
Figure 8: Example of a job offer that we find in the INAEM PDF document.
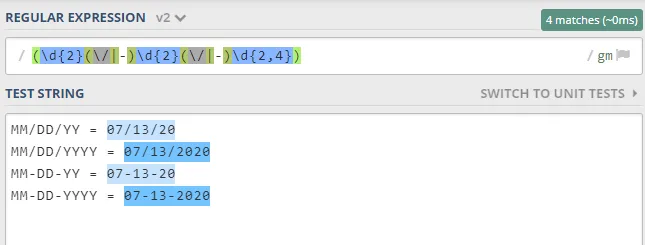
During the process of extracting textual information from PDF documents, the Python library Tika [6] was used. The text resulting from the extraction for each PDF document was separated by professional sectors and then by job offers. From each offer, the texts of greatest interest to be analyzed were extracted ("sector", "offer identifier", "publication date", "title of the offer", "city", "province", "INAEM office", "global description", "specific description", "tasks to be performed", "requirements requested by the company", and "working conditions"). To do this, we apply regular expressions [7], also known as regex for its contraction of English words regular expressure, which is nothing more than a sequence of characters that forms a search pattern on the texts. In the following figure you can see an example to find the “publication dates” within the offer texts.
At first glance they look like data tables with a similar pattern and a specific order. But the truth is that in practice it is found that this is not the case. Each office has its own uses and customs, which makes data processing difficult. For example, some write towns with capital letters, and others only the initial is capitalized. This makes it identified as two different populations if we see an offer in BARBASTRO and another in Barbastro, they can also be differentiated by accents (for example, Sabiñánigo and Sabiñanigo) or because they are simply written incorrectly (for example, concinero instead of cook, grú to refer to crane, etc.). There are also duplicate job offers, and as for the characteristics of the global description of the offer, in some offices they detail them as "Requirements" and in others as "Tasks", among other differences. Some offices even do not put labels that separate the different concepts within the description, which prevents the model from being applied.
Example 1.- It has the labels of TASKS, REQUIREMENTS, CONDITIONS
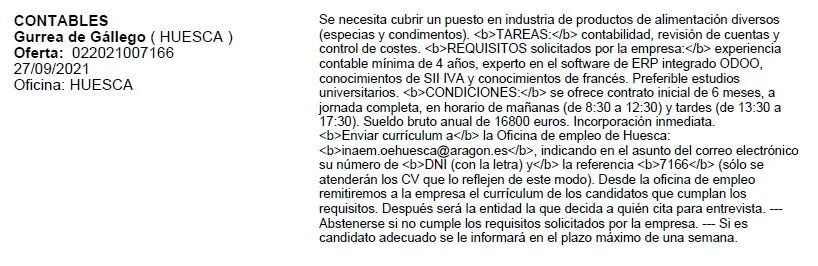
Example 2.- Without labels or separation. Only “Functions” appears without capital letters or bold

In the phase of analysis and verification of the quality of the extracted data, we identified this set of problems, which were treated for subsequent exploitation from the dashboard: we eliminate duplicate job offers (ensuring we have a unique identifier per offer), correcting offer names, cities, provinces, employment offices, and misspelled descriptions from dictionaries. We have also had to unify texts that mean the same for different characteristics.
With the purpose of extracting complementary information to that obtained from the PDF documents, we applied in parallel the technique of web scraping to the INAEM job offer search engine in Aragon [5], as is the case of the “professional level”, “requirements” and “contract duration” of the job offers, which only appeared on the website. Additionally, the web scraping It allowed filling in empty values that could not be extracted from the PDF documents, such as “general descriptions”, “working conditions”, names of “cities” and “provinces”, as they were both on the web and in the PDF documents. Maybe he web scraping It would have been enough to have a first version of the data related to INAEM job offers, but the “sector” and “employment office” fields of each of the offers were only present in the PDF documents, which we considered very important to study from the dashboard. For all of the above, it should be noted that a large part of the project was dedicated to the phase of extraction, analysis, cleaning and homogenization of the information.
Dashboard of job offers in Aragon
In order to facilitate the analysis of the current situation of job offers in Aragon, we developed a dashboard using the Streamlit library [8]. This python library offers an open source platform that allows you to easily create and share custom web applications for data science and machine learning. The source code of the dashboard and the textual extraction and preprocessing is available at our GitHub repository [9].
The dashboard has 4 main sections that we are going to develop below. Although there are more than twenty sectors, we wanted to focus above all on tourism, as it is important in the Aragonese economy and with requirements and terms that are better known to society:
- 1.- Study of offers by criteria:
In this section we know the number of offers there are according to the following search criteria: sector, office and province.
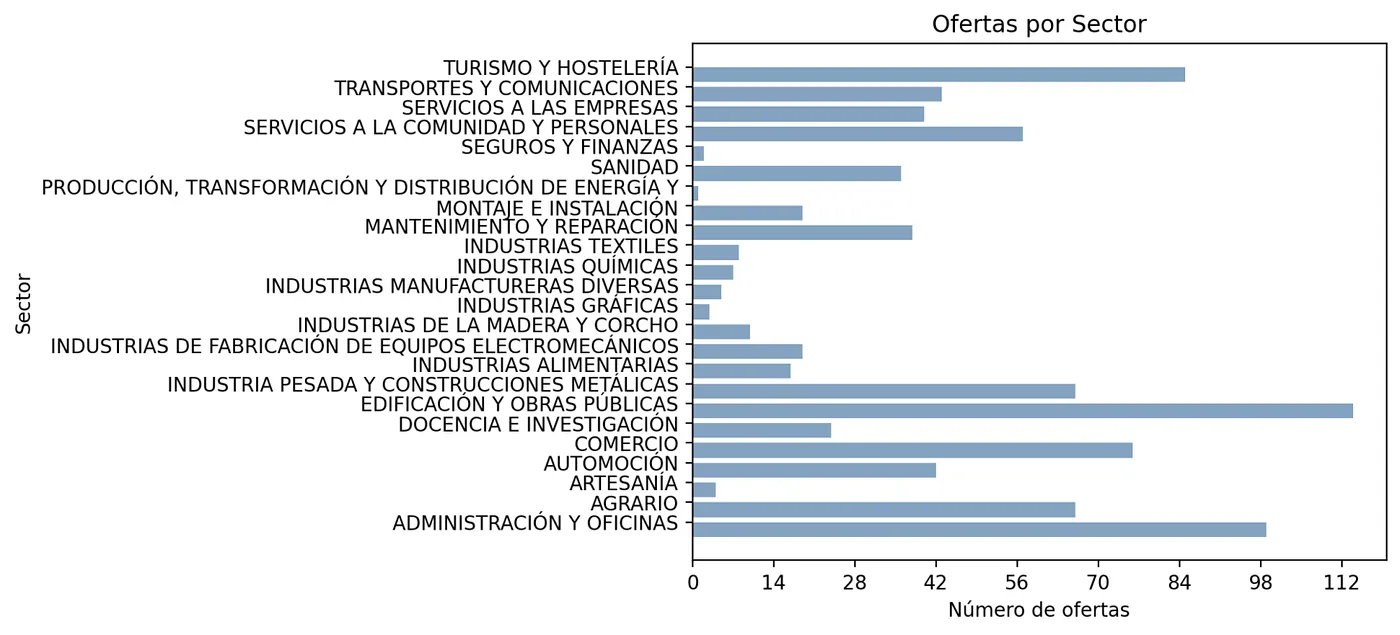
According to the selected criterion, a bar graph is generated.

Figure 9: Screenshot of study of offers by criteria
Analysis:
With the criterion “Sector” We analyzed 24 of the 28 sectors covered by the National Employment Service website. There are 4 sectors that the INAEM either does not contemplate, or there are no job offers for them. Those 4 sectors are Information and artistic manifestations, Mining and first transformations, Fishing and aquaculture and Skin and leather. We see that the three areas that have presented the most offers from November to here are Tourism and Hospitality (in the middle of the snow season and with the Christmas holidays), Administration and Offices and Building and Public Works. The ones that have requested the least personnel in this time are Production, Transformation and Distribution of Energy, Insurance and Finance and Crafts. In this graph in this period we can observe the temporality, with a lot of demand in Hospitality (one of the high seasons of tourism in Aragon) and with a contained supply for example in Agriculture, since in winter field work decreases.
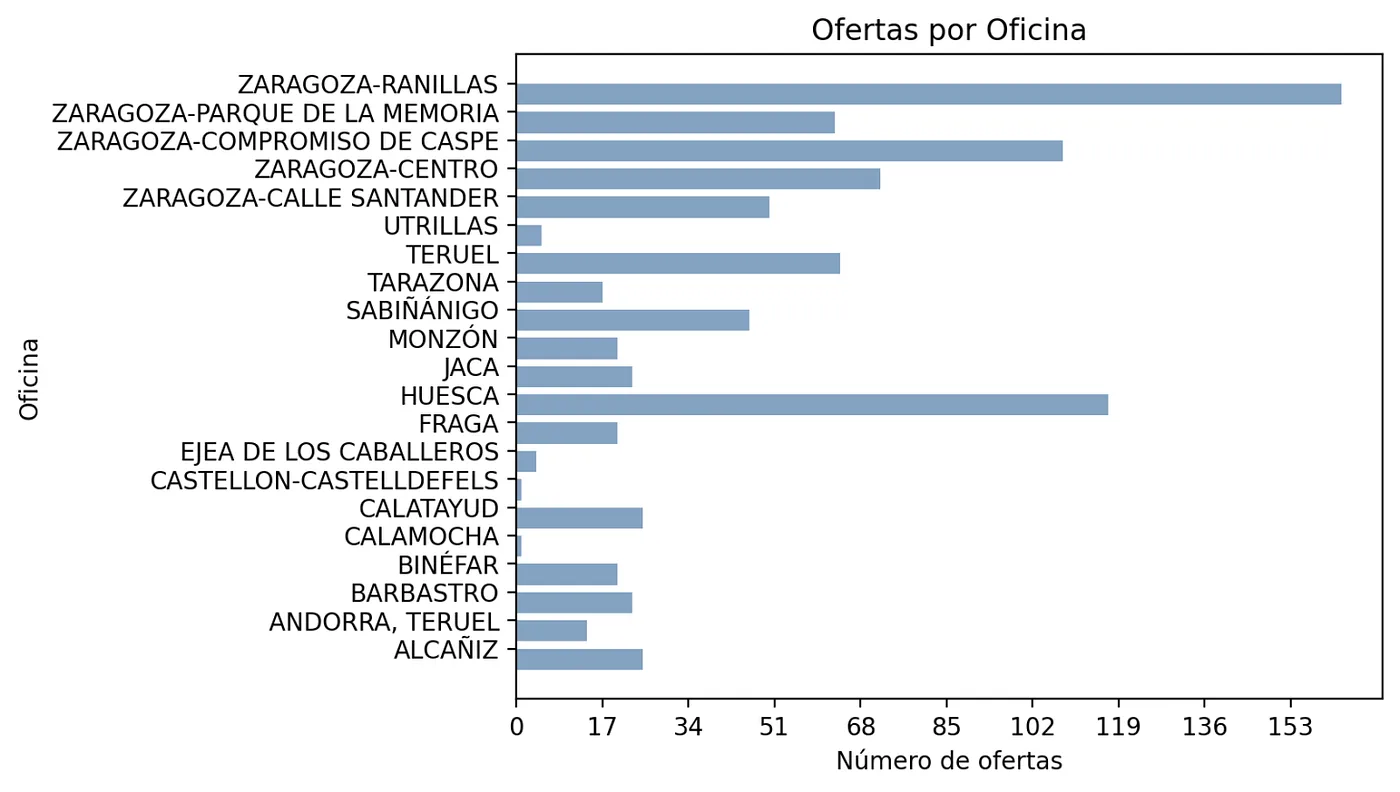
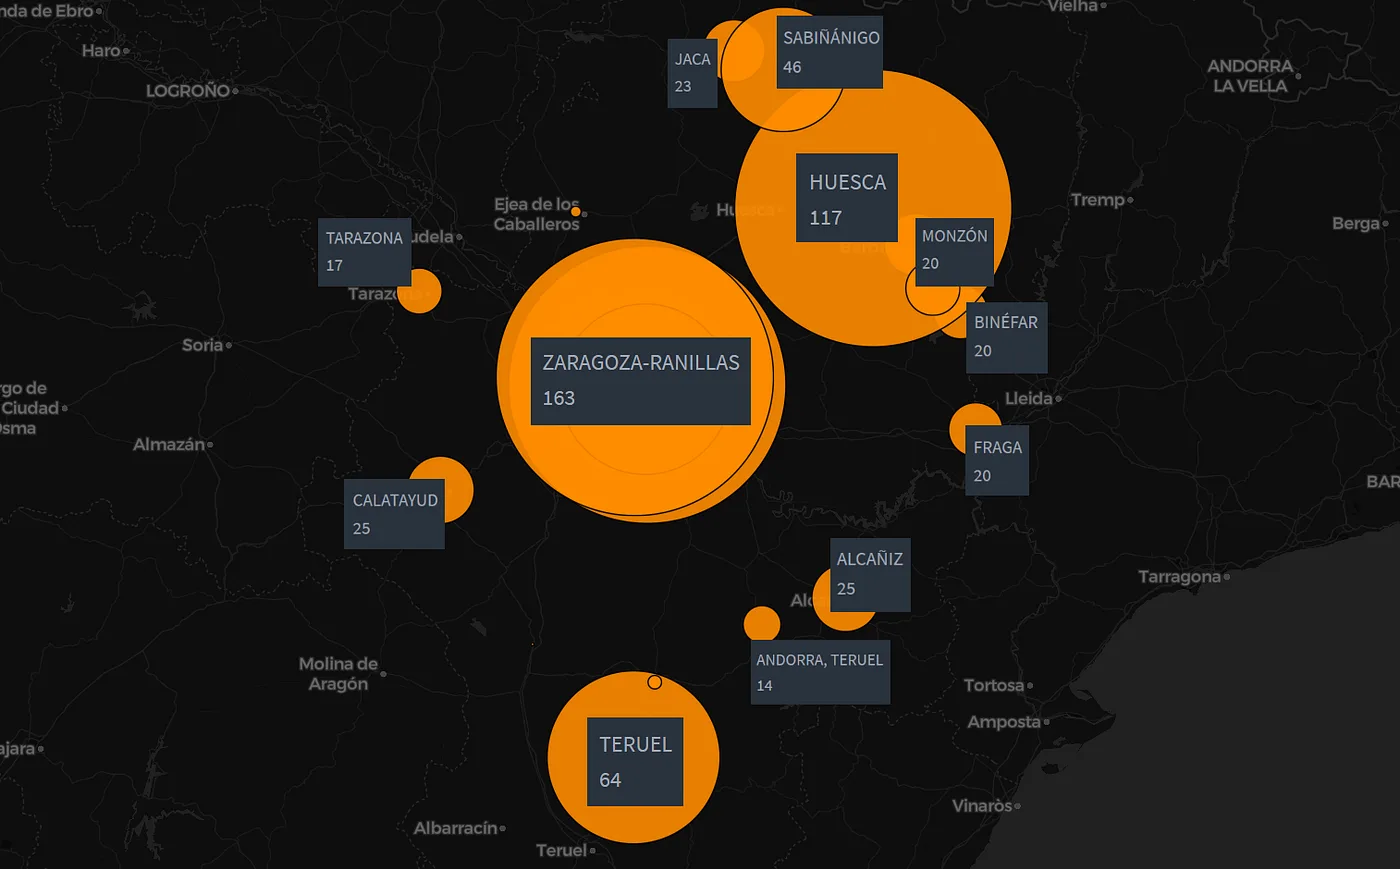
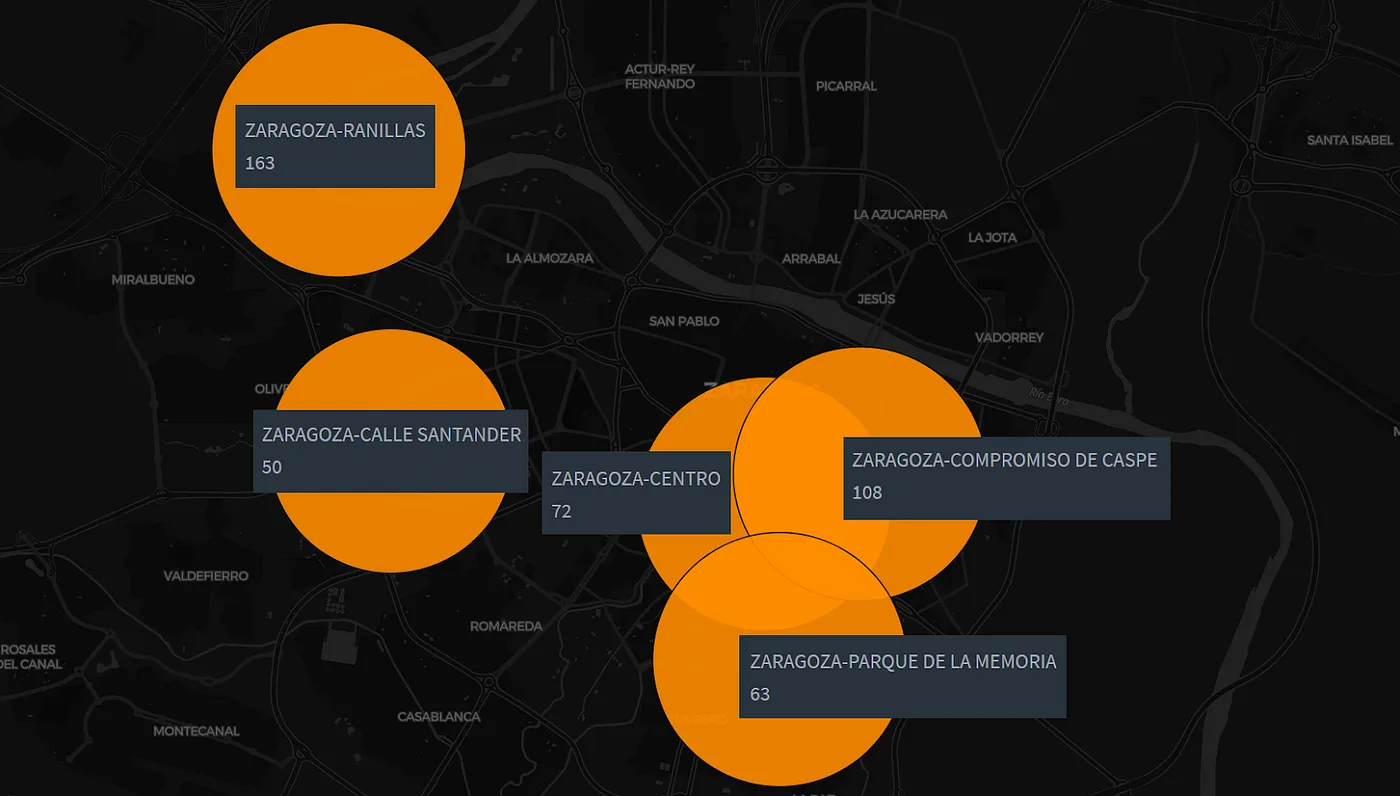
With the criterion “Office"We observe that with much difference, that of Zaragoza Ranillas It is the one that manages the most job offers in the entire community. It is followed by the office of Huesca Capital. Zaragoza has five employment offices, two of which, Zaragoza Center and Zaragoza Caspe Commitment, the following are placed in the ranking of the first five, which would close the office of Teruel Capital. Outside of the three provincial capitals, it stands out Sabiñánigo in number of job offers. In this branch, the industrial offer of the capital of Alto Gállego joins the abundant hospitality and tourism sector of the Tena Valley, which is complemented by construction and livestock. In the list there is an office that does not correspond to Aragón. This is because the Castellón and Castelldefels (Barcelona) offices have launched offers to Aragón looking for shearers.
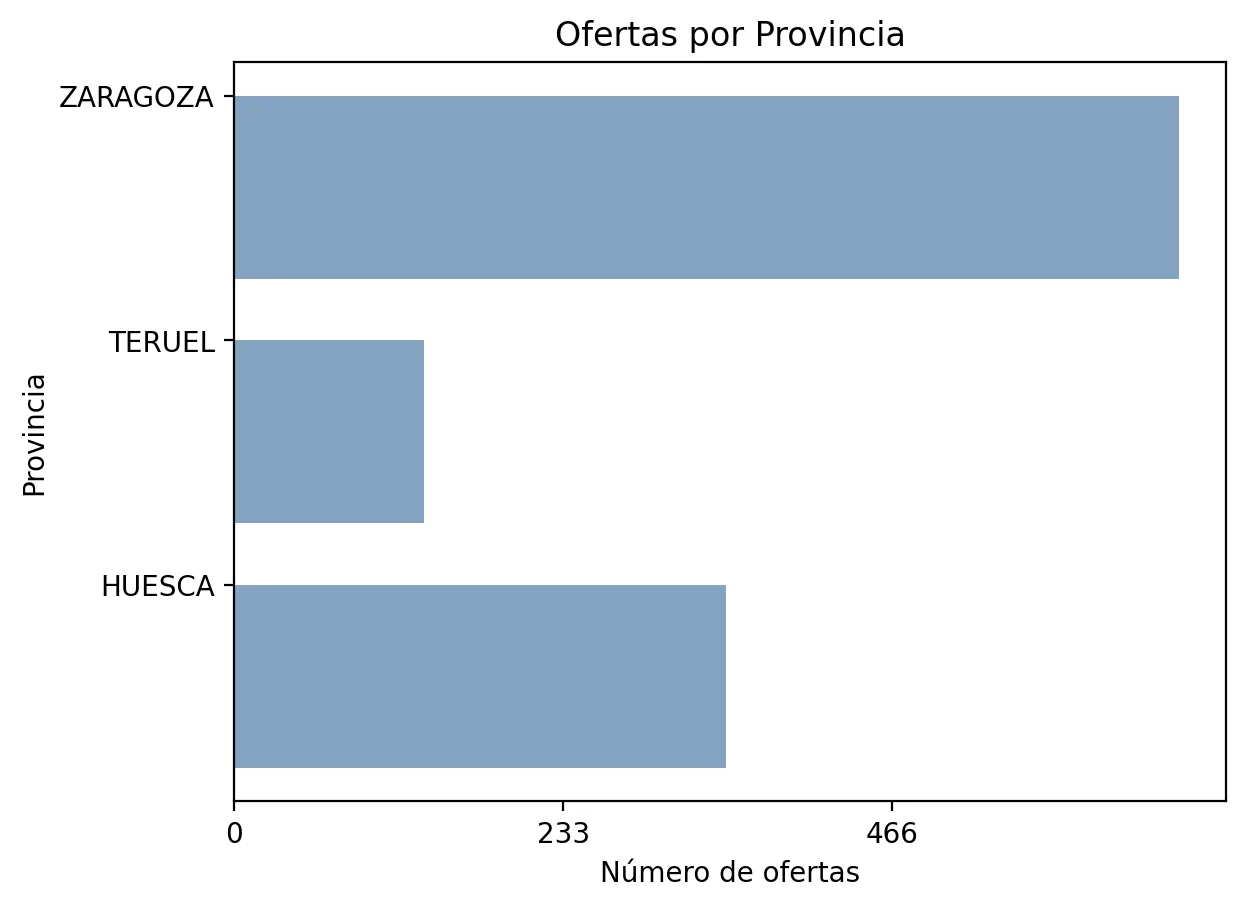
With the “Province” criterion we observe the current proportion of offers that are distributed among the three provincial territories of Aragon.
- 2.- Study of offers by date: In this section we cross-check several of the data that we find in the offers, to achieve more specific conclusions or more adjusted profiles. A temporality graph is generated, which facilitates the analysis of the number of job offers by combining various criteria, such as year, labor sector and province.
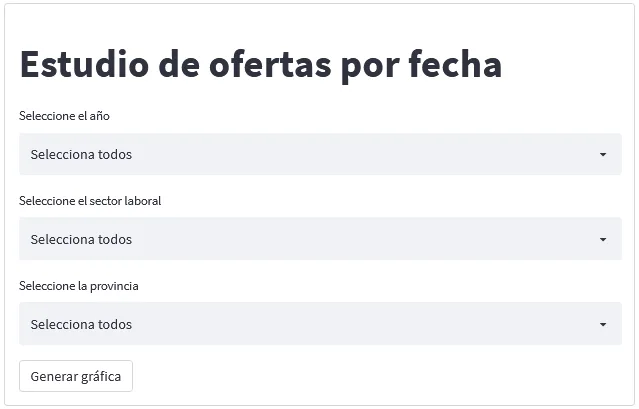
Figure 10: Screenshot of offers study by date
Analysis:
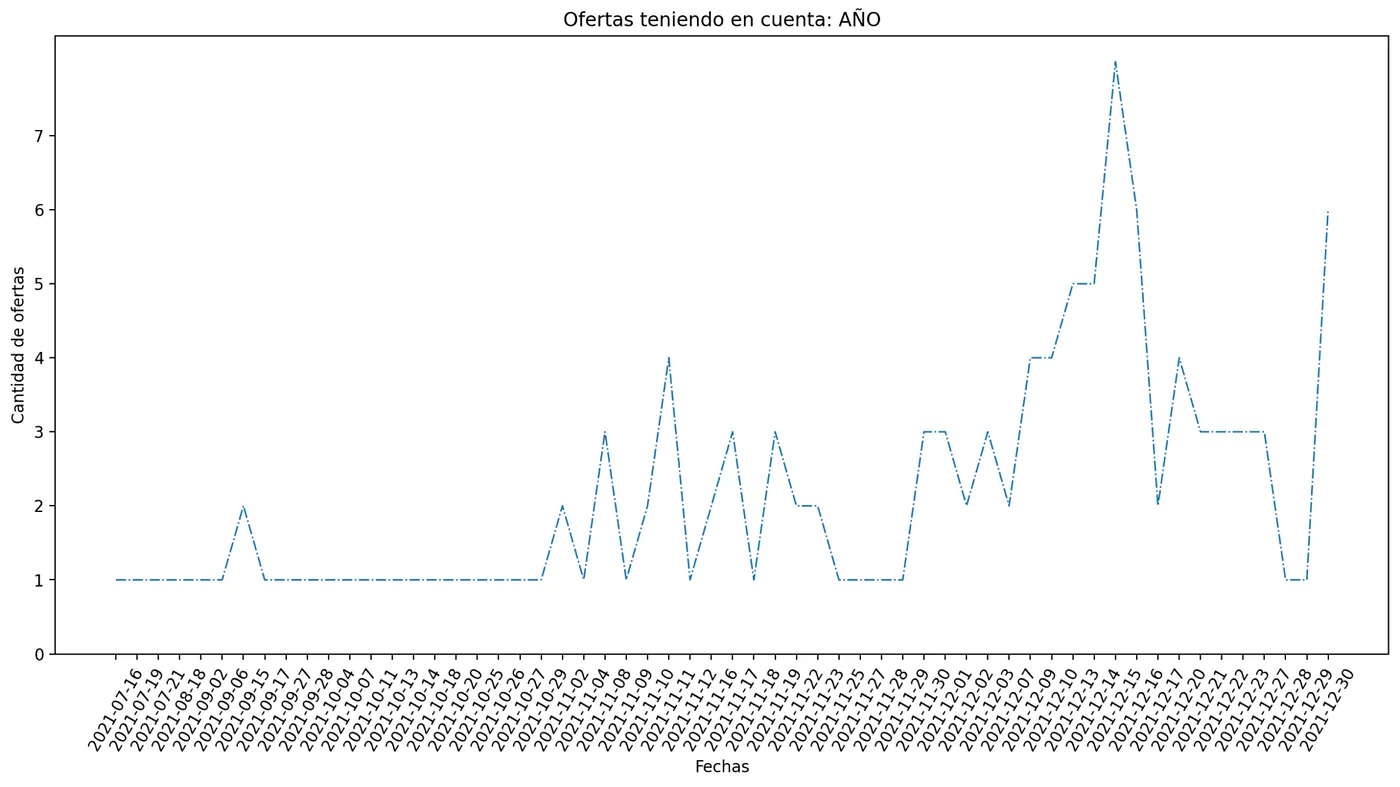
If we select the “YEAR” criterion we can obtain only one specific one, like this graph, corresponding to 2021 for all of Aragon. A peak in job offers is evident in mid-December, after the long weekend, just before hiring for the Christmas campaign.
For the year 2022 throughout Aragon, we see little supply in the first days, which are still holidays, and a notable peak at the end of the month of January. The drop in offers in mid-February is striking, which then recovers with a new peak in demand for workers at the end of the month.
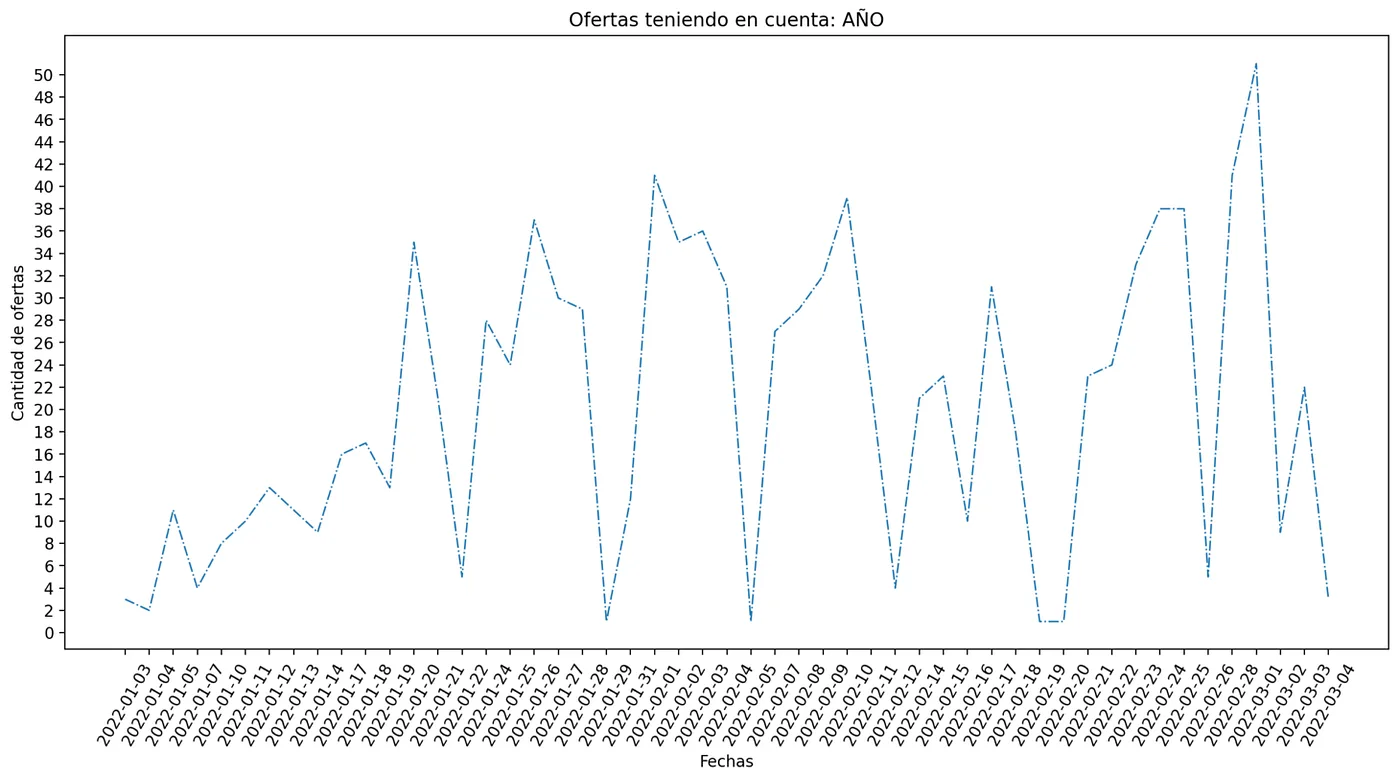
And we can join the two periods that we currently have, 2021 and 2022. In this graph, we add the “PROVINCE” criterion selecting Zaragoza. We find similar conclusions in these parameters, with peaks in mid-December and the end of January, and a drop in offers in mid-February, to find a significant rise at the end of this month.
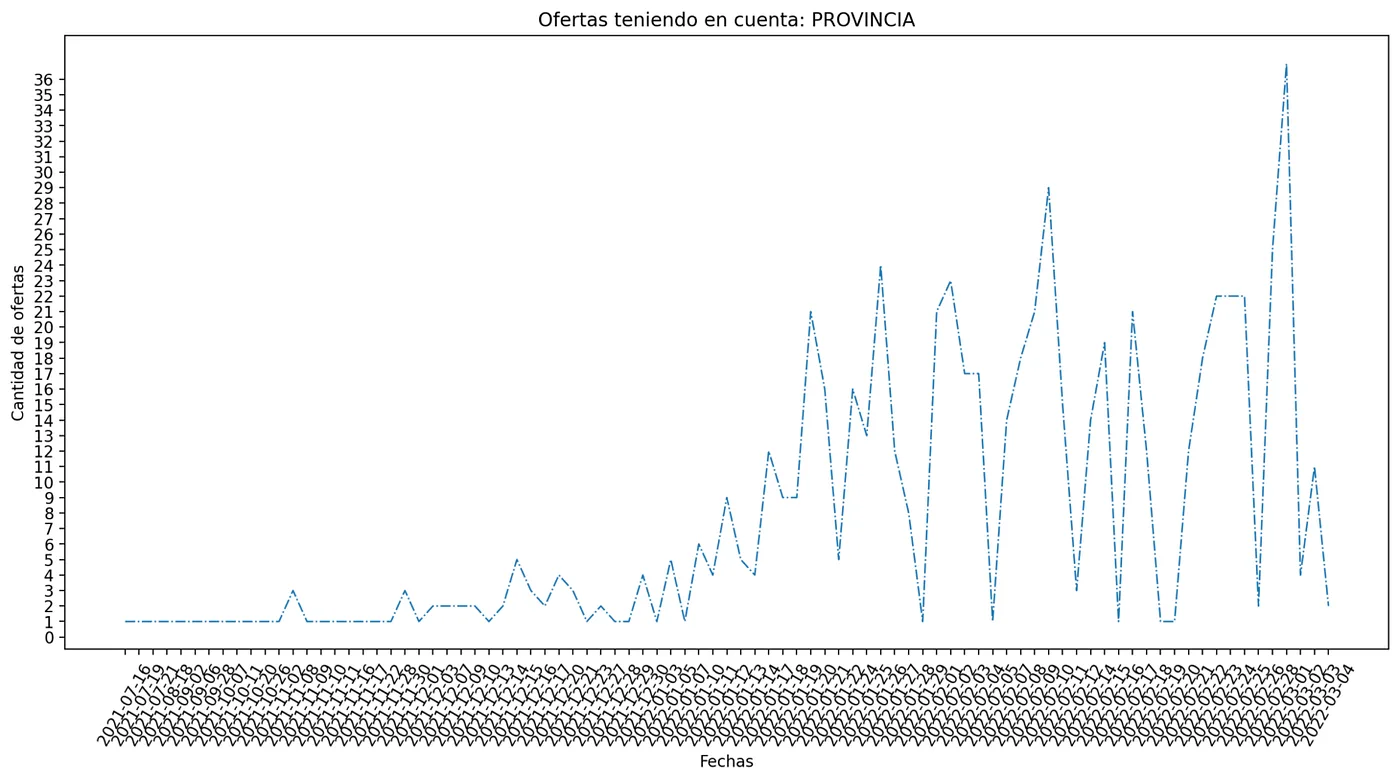
We now analyze the number of offers applying the “PROVINCE” criterion in this case in Huesca for the year 2021 and 2022. The peak of offers at the end of January is very striking, with a view to a longer-term contract. The decrease in proposed jobs in mid-February is also notable.
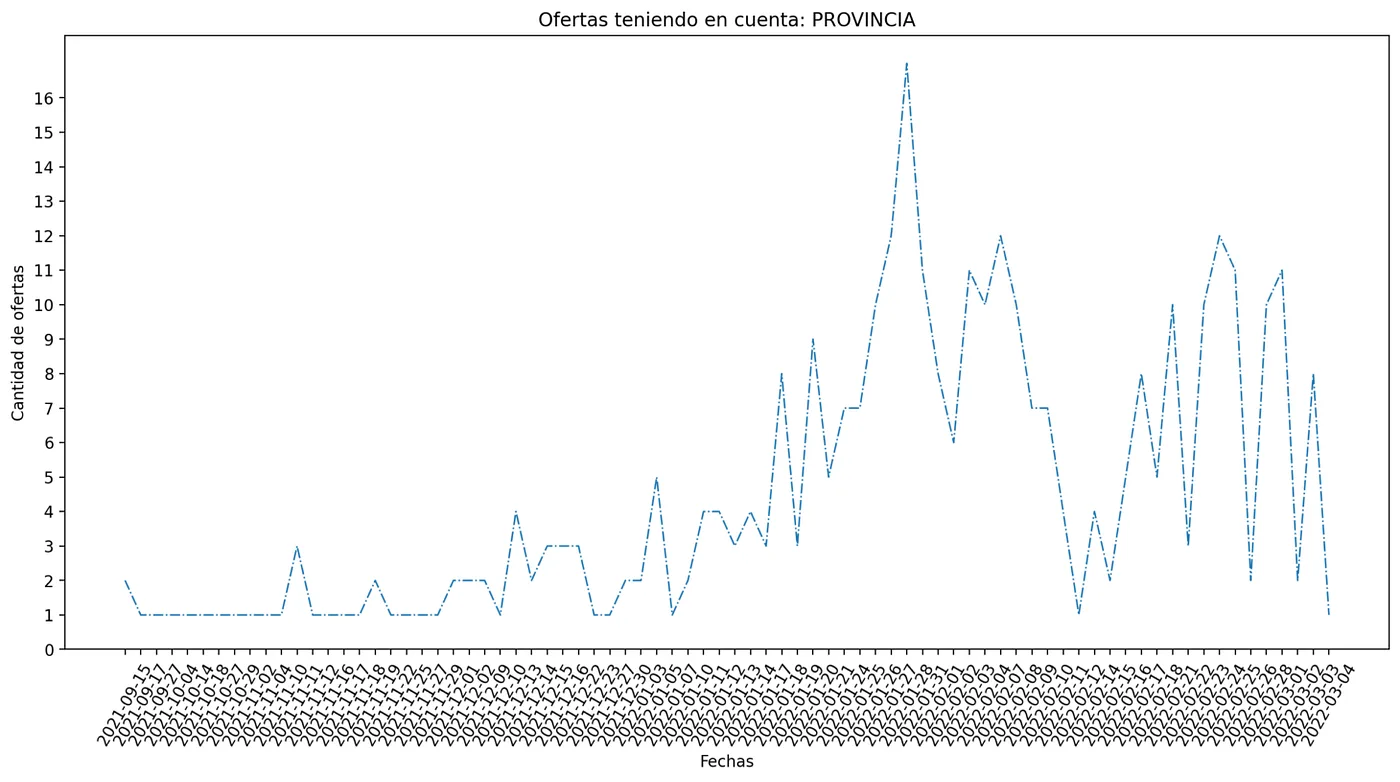
Regarding the number of offers in Teruel for the year 2021 and 2022, the peak at the end of January is also very striking, and also a significant drop in the middle of February:
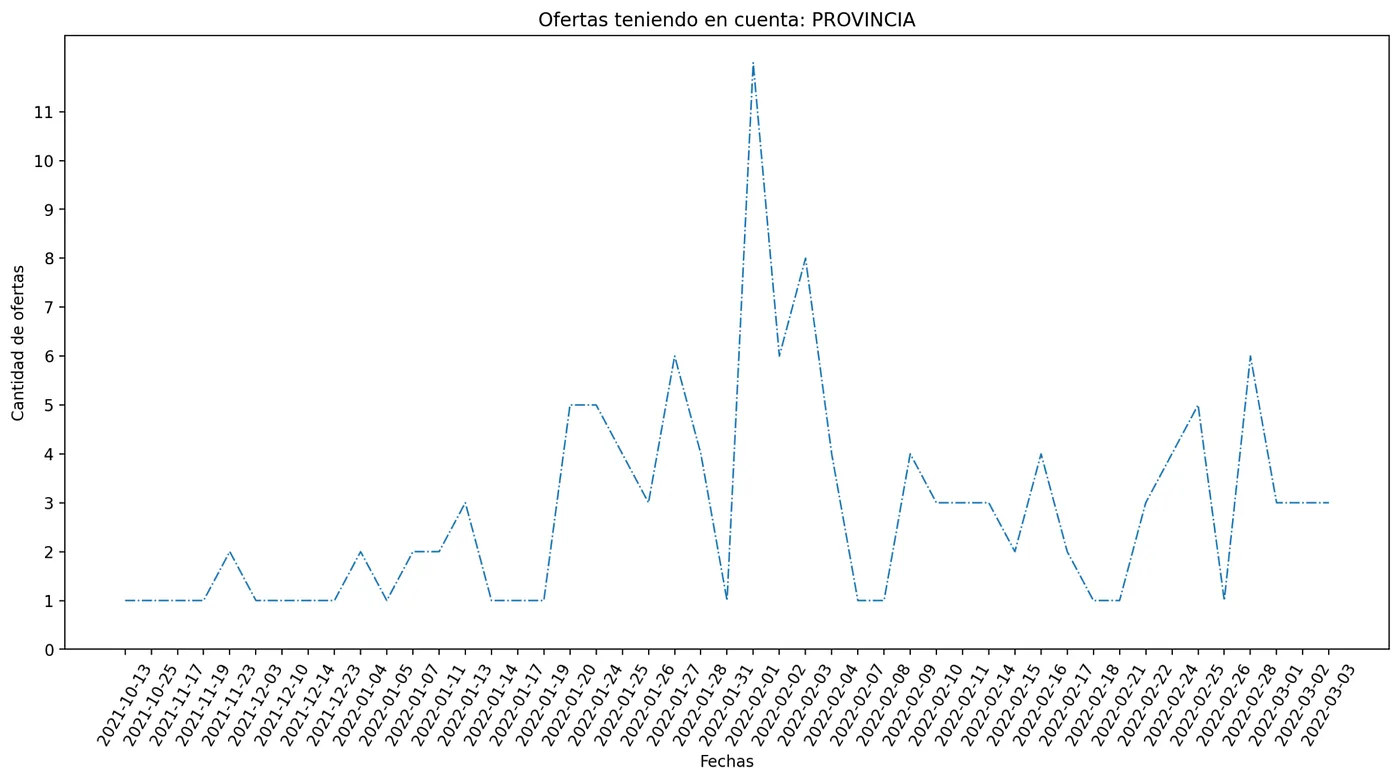
And it can also be analyzed by applying the three criteria, that is, for each of the sectors/years/province.
For example, here we study the TOURISM AND HOSPITALITY sector and the ZARAGOZA province for all years. There is an increase at the end of January, perhaps preparing for the San Valero festive long weekend or in anticipation of the elimination of some hospitality restrictions, which took place at the beginning of February.
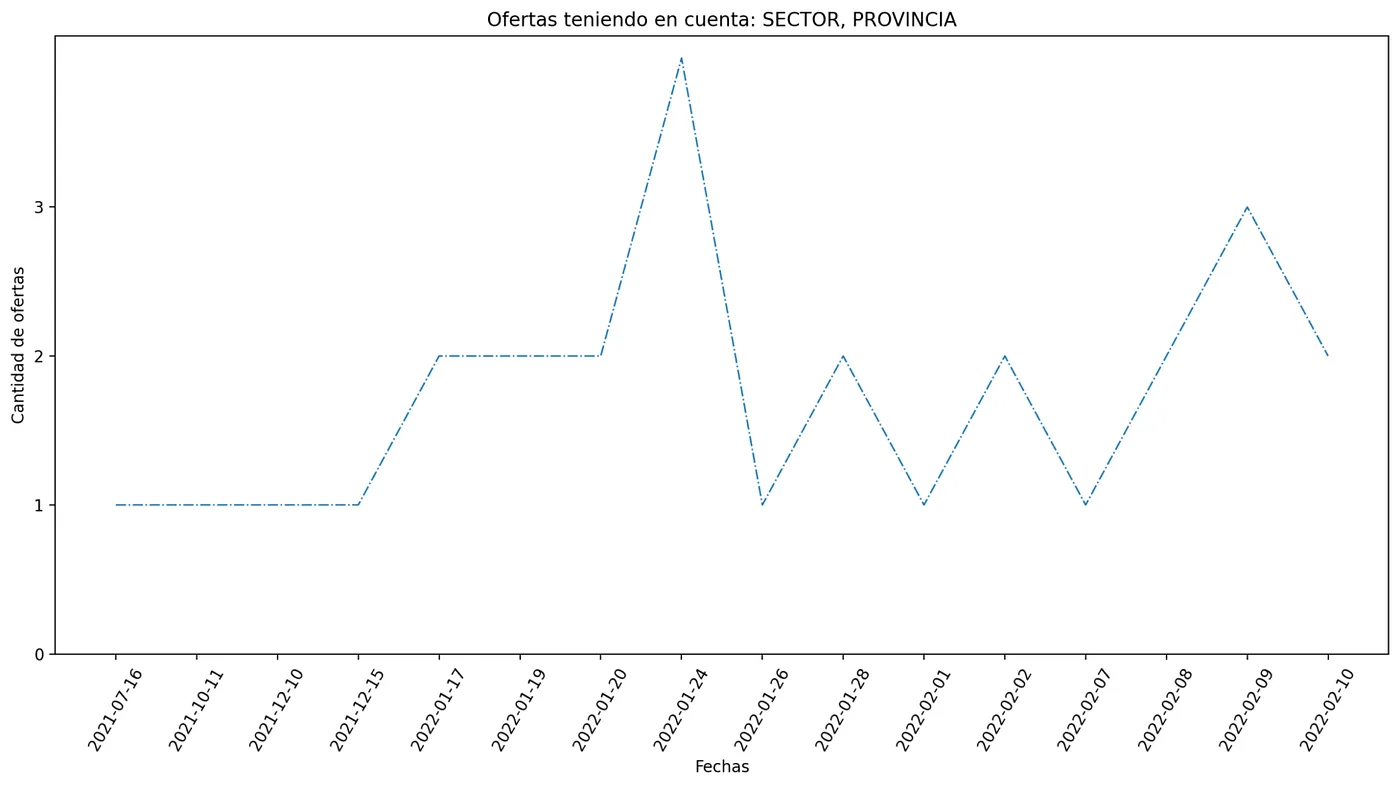
In this other graph, we have selected the BUILDING AND PUBLIC WORKS sector, also in the province of Zaragoza, with very unequal demand for workers these days.
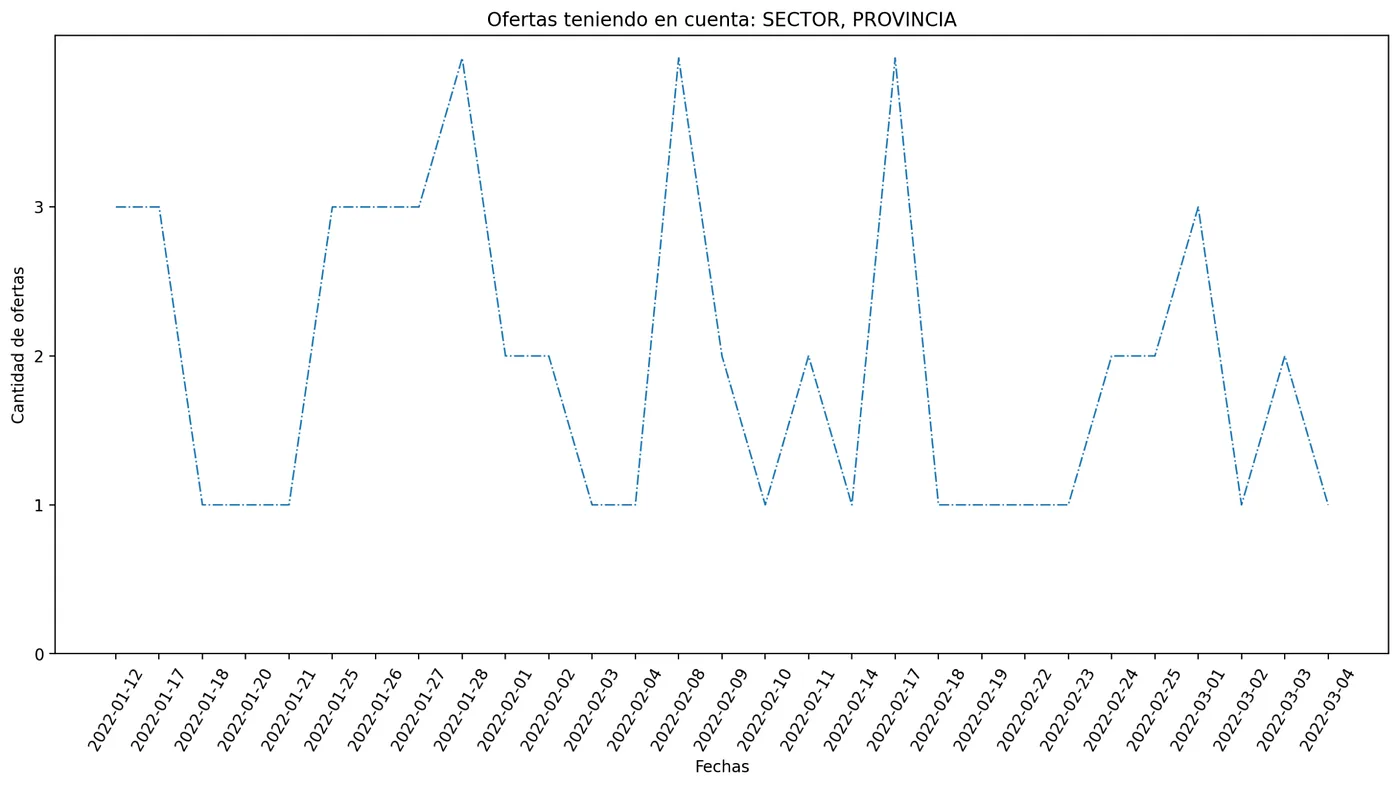
- 3.-Word cloud: We generate a cloud of words from the texts that contain the titles and global descriptions of the job offers, which can be filtered by professional sector. Additionally, you can adjust different configuration parameters of the word cloud, such as the color of the image background, the color of the most frequent words, the maximum number of words to generate, the maximum size of the background, and the random state so that it shows different words for each defined value. On the other hand, it allows you to upload an image (silhouette type) to generate the word cloud with the shape of the figure drawn in the image. Our idea of “to know is to love” applied to this project has encouraged us to give it a heart shape. It is a very valuable tool, because beyond the data, it allows us to identify other concepts that are not detectable in a first analysis of job offers. We explain it below.
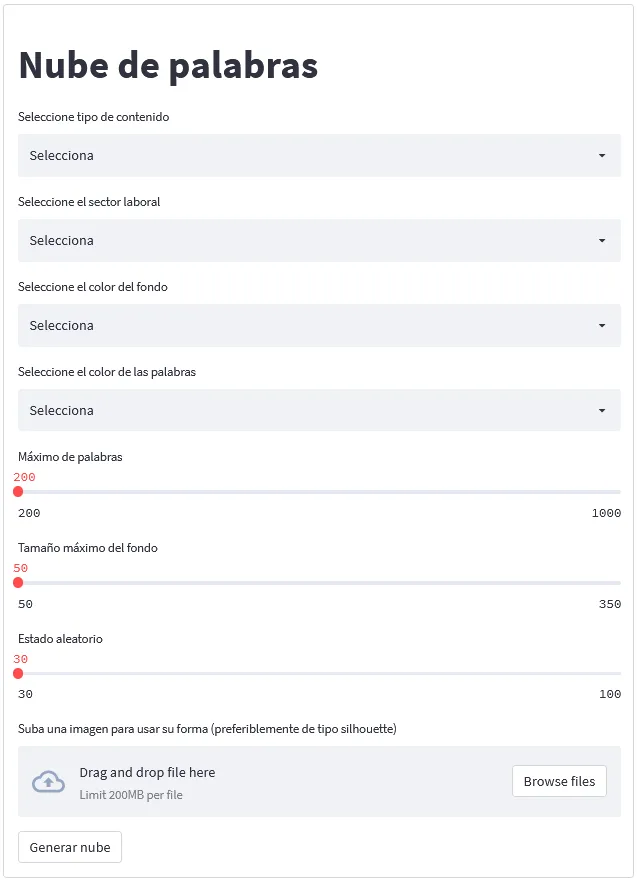
Figure 11: Screenshot of the word cloud.
To perform the exploratory NLP data analysis [11], we used the Python library WordCloud [10]. From this library we were able to make a visual representation of the words (also known as a word cloud) that make up the texts of the titles and global descriptions of the job offers, where the size is larger for those words that appear more frequently. The word cloud graphics allowed us to visualize the key words contained in the texts for subsequent study. Prior to the visual representation and as part of the natural language data processing, we eliminate from the text a set of stop words (known as stop words), which are meaningless words such as articles, pronouns, prepositions, etc.
Analysis:
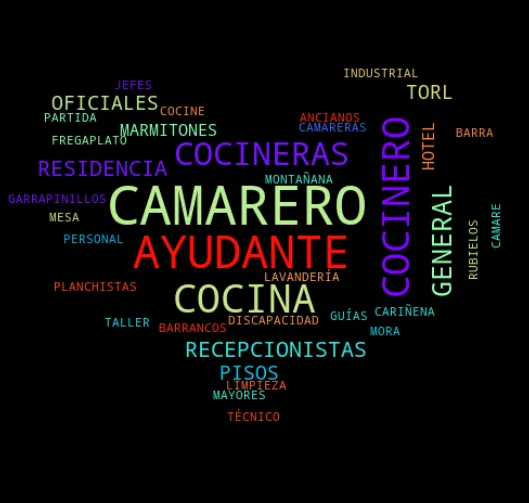
For the first cloud of words that we analyze, we have selected, for example, the criteria Offer + TOURISM AND HOSPITALITY Sector. That is, this word cloud is with the heading of the Offer.
In the word clouds, the most used or common terms within the text appear. It was expected to find 'Waiter', 'Cook' or 'Bar'. But we find other terms that give us clues to trends. For example, there are several municipalities where there is a special demand for Hospitality (Rubielos, Garrapinillos, Montañana, Cariñena), and other Hospitality services that are not the majority (Residence, planchistas, marmitones, elderly or disabled). This allows us to analyze, for example, an emerging trend within this sector providing residential services, and various specializations that are needed in Aragon, such as Canyons. We observe gender bias since much more requests are made for Waiters (very big) than Waitresses (very small), or cook a little bigger than Cooks. It is striking that the demands specify gender.
If we go to another criterion, we can analyze the text of the Global Description of the offer, also in the same TOURISM AND HOSPITALITY sector. A good part of this cloud is taken up by words that indicate administrative procedures derived from labor management. But there are several terms that offer us characteristics of the sector. Among the highlighted words, for example, is 'Experience' and also 'full day' which reads quite large, compared to 'partial day' which is also found in the cloud but much smaller. On the other hand, 'temporary contract' appears larger than 'indefinite contract'. Among the requirements requested is also a driver's license or the possibility of driving for work.

We now analyze another very different sector. We select OFFERS and BUSINESS SERVICES sector. In such a generic sector, the terms that appear offer us valuable information about the profiles that are sought. Among the most, Technical, Occupational Risks, Prevention, Teleoperators, Security or IT. A very simple way to define profiles in this sector.

We provide one more example of OFFER in this case, that of the FOOD INDUSTRY. In such a diverse sector, the characteristics of the Aragonese market are defined in its butchery aspect. Cutting, Meat, Butcher, Tripería, Meat, Avian, Animal, Slaughterhouse, Butcher shop They make up the majority of the words in the cloud.

- 4.- Map of offers: With this option, a map is generated where you can view the number of offers for each province, unemployment office in Aragon and population where the job is offered, with circles that expand their radius proportionally to the number of jobs.

Figure 12: Screenshot of the offer map.
MAP 1.- With the purpose of automatically obtaining the latitude and longitude of the provinces, cities and employment offices in Aragon, we use the GeoPy library [12]. On the other hand, the Python library pydeck [13] was used to visualize the data on the map in an interactive way. Figure 13 shows an example of a geographic map visualization with the number of job offers for each of the provinces of Aragon.
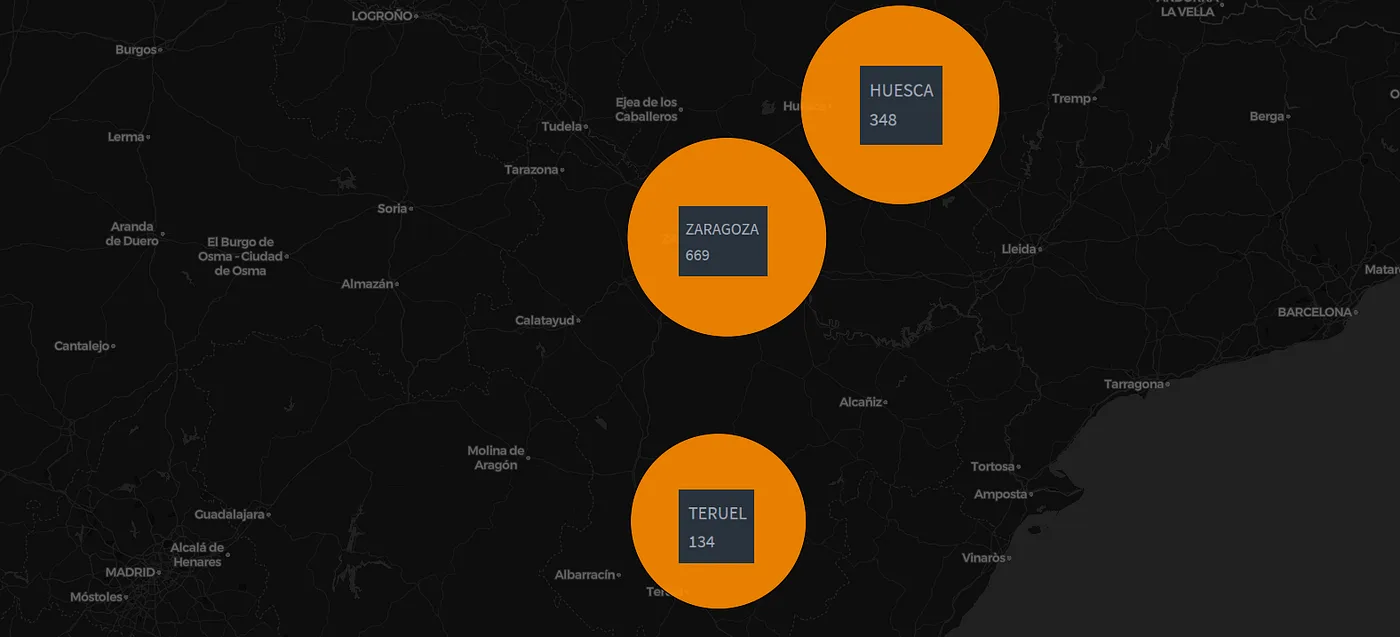
Figure 13: Example of a geographic map of offers for each of the provinces of Aragon.
Analysis:
With this first map image, at a glance we get an idea of how the volume of INAEM offers in Aragon is distributed among its three provinces. The highest proportions are in Zaragoza and Huesca, and there is a greater distance from those in the province of Teruel.
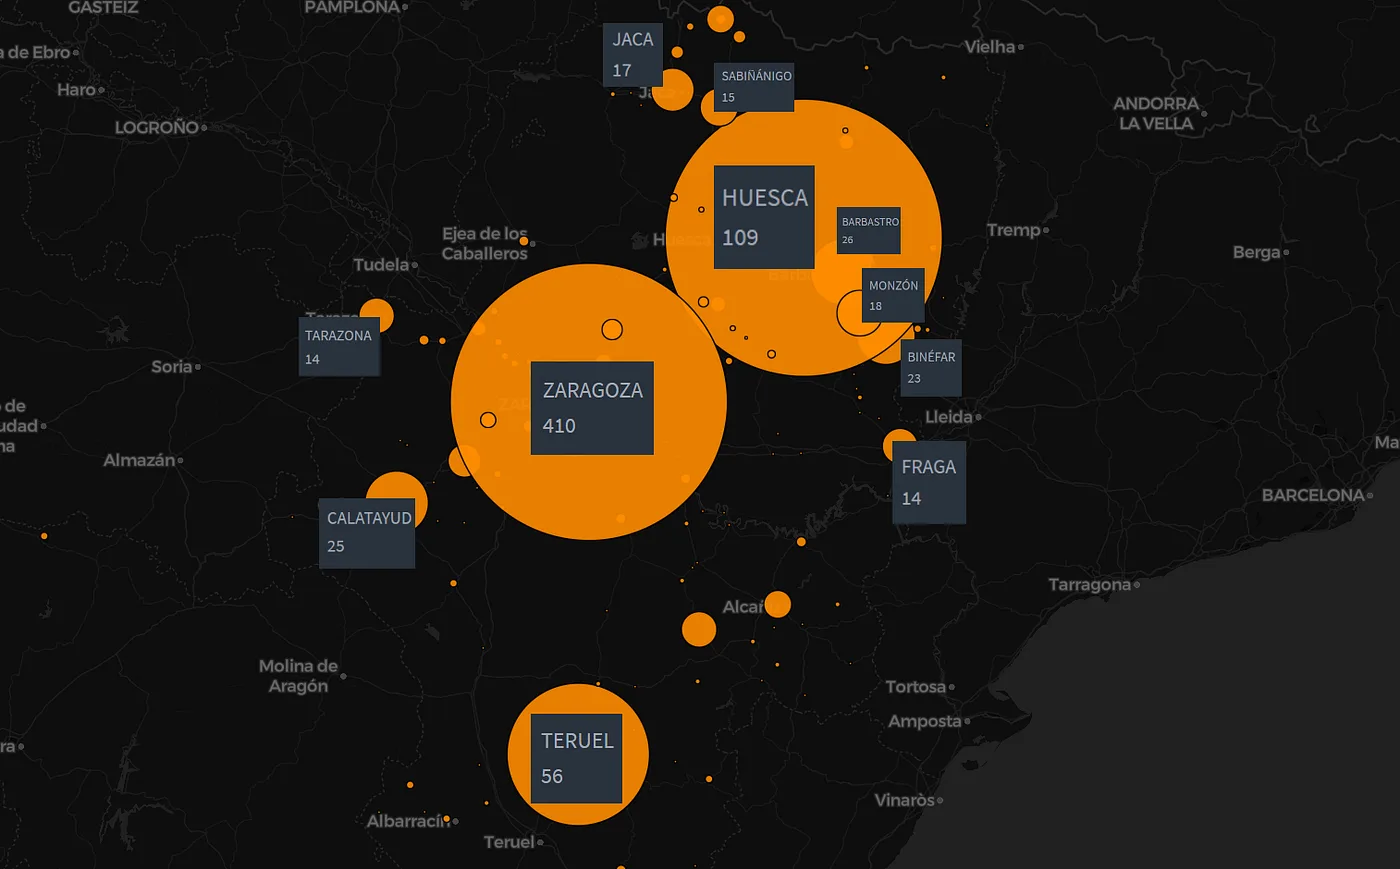
MAP 2.- The next possibility offered by our model reflects the populations where jobs are offered. This map can become a valuable tool for territorial planning. Observing the evolution over days or months can provide information, for example, on the needs of housing, education or services, or on the contrary, warn of the risk of depopulation or the beginning of migratory movements of the inhabitants of an area looking for work elsewhere.
MAP 3.- The third possibility is to know the volume of job offers in each INAEM office in Aragon. We can observe it in a general way, including those of the entire autonomous community as in this graph.
Or go closer and discover the options of the different offices within the same city, as is the case in Zaragoza.
Conclusions
In this article, we have presented the project developed in Saturdays.AI-Zaragoza, a first step to contribute to society, given the lack of tools that make it easier for Aragonese to study in global terms the current situation of job offers in their community.
As we have explained, among the problems we have encountered is the different indexing according to each INAEM office. If all of them filled out the same online template with exactly the same criteria, the processing of the data would be much simpler and immediate. What good is data if it is not semi-structured? What if there is no pattern that facilitates the extraction of information? If our approach were also implemented and compiled with this data day by day, it would be a valuable weapon for the management of employment in the community of Aragón, allowing us to know in a timely manner the evolution of the different sectors, of the places where work is offered, of the requirements that companies request for their future employees. A lot of our work has gone into fixing details that shouldn't be there. If we had not found these differences in the forms of data classification, our study would allow us to talk about other deeper and more precise analyzes and even advanced machine learning models.
Simply continuing to add data daily to this work would allow a very detailed study of how the labor market behaves in a year, thus analyzing the evolution of such temporary sectors as agriculture or tourism, both with a very relevant weight in the Aragonese economy and even being able to predict the future needs of the Aragonese labor market.
In addition to all this, some of the main contributions made by this work are the following:
- It is a tool that increases knowledge about job offers in Aragon.
- Manages to organize the INAEM data despite the difficulties.
- Creates a natural language interpretation system from which we obtain the desired data.
- Automatic generation of bar graphs based on data by sectors, office and province.
- Automatic generation of graphs according to independent criteria or combined with year, sector and province.
- Automatic generation of word clouds, which in addition to analyzing the offer, offers us new ideas or criteria, emerging concepts that are very interesting for analyzing the offers.
- Automatic generation of maps that allow you to have a view of the offers directly on the territory, which offers a valuable tool for understanding the evolution of employment and its impact in the different regions.
What can it be applied for:
- Mark training lines for companies or governments.
- Give direction to young people who are looking for a job horizon to make decisions regarding their training for the future.
- Provide information to companies about the requirements in the market for a specific position, and know the average hiring conditions.
- Know the time it takes to fill a position in a sector.
- Know the places in Aragon where jobs are in demand and where they are not.
- Job demand according to the time of year. Evolution of temporality.
- Planning the organization of the territory and society according to the needs of the population that may move in search of employment.
As lines of work to continue based on what we already have, we can continue with the development and improvement of the dashboard.
And looking to the future
- It could be developed so that the program was enriched with more information that it incorporated daily automatically.
- It could be converted into a real web application that can be consulted by authorities related to economic and social management, companies, workers, unions, students, etc.
- Incorporate other employment platforms, since INAEM's does not represent all the existing offer. It would require a complex study to find on these other platforms a way to homogenize the information, that is, unify into a single characteristic those texts that mean the same but are categorized under different labels. This could even happen within the same platform, as we have at INAEM.
Acknowledgments
We appreciate the opportunity that Saturdays.AI has given us to learn the basics of Artificial Intelligence, despite not being experts in the field. And above all to María del Carmen Rodríguez Hernández, for all the help she has given us and all the hours of support, without which, this would not be a reality.
References
[1] La Comarca Newspaper “Concern about the lack of labor in Teruel” 01/27/2022 https://www.lacomarca.net/preocupacion-falta-mano-obra-teruel/ (Accessed February 25, 2022)
[2] C. Porteiro, La Voz de Galicia Newspaper “Europe loses 30,000 million euros annually due to lack of labor” 10/16/2021 https://www.lavozdegalicia.es/noticia/economia/2021/10/16/europa-pierde-30000-millones-euros-anuales-falta-mano-obra/0003_202110G16P28991.htm (Accessed March 3, 2022)
[3] Sustainable Development Goals. UNDP. https://www.undp.org/es/sustainable-development-goals (Consulted on February 24, 2022)
[4] P. Haya. The CRIP-DM methodology in data science. https://www.iic.uam.es/innovacion/metodologia-crisp-dm-ciencia-de-datos (Consulted on February 24, 2022)
[5] INAEM: Job Offers in Aragon. https://inaem.aragon.es/ofertas-de-empleo (Consulted on March 2, 2022)
[6] C. Mattmann. Python Tika Library. https://github.com/chrismattmann/tika-python (Consulted on February 24, 2022)
[7] López, F., & Romero, V. (2014). Master Python regular expressions. Package publishing. p. 110. ISBN 978–1–78328–315–6.
[8] A. Treuille, A. Kelly and T. Teixeira. Streamlit. https://streamlit.io (Consulted on February 25, 2022)
[9] M. Morao and E. P. Nogarol. Dashboard of Job Offers in Aragón.
https://github.com/marianamorao/eq_1_demanda_empleo (Consulted on March 4, 2022)
[10] A. Mueller and et al. Python WordCloud Library. https://github.com/amueller/word_cloud (Consulted on February 25, 2022)
[11] H. Suresh. WordClouds: Basics of NLP. Medium. 06/03/2020 https://medium.com/@harinisureshla/wordclouds-basics-of-nlp-5b60be226414 (Consulted on March 4, 2022)
[12] K. Esmukov and et al. GeoPy Python Library. https://geopy.readthedocs.io (Consulted on February 25, 2022)
[13] X. Chen and et al. Python Pydeck library. https://github.com/visgl/deck.gl/tree/master/bindings/pydeck (Consulted on February 25, 2022)
Members
- Mariana Morao Santos
- Esther P. Nogarol
Project presentation: Demoday
Repository
In the following repository you will find the code used to develop this application: https://github.com/SaturdaysAI/Projects/tree/master/Zaragoza/eq_1_demanda_empleo-main/eq_1_demanda_empleo-main
More artificial intelligence!
The mission of Saturdays.ai is to make artificial intelligence more accessible (#ai4all) through intensive courses and programs where projects for good are carried out (#ai4good).
Explore our AI master’s programme at https://saturdays.ai/master-ia-online/
If you want to learn more about artificial intelligence join our community at community.saturdays.ai or visit us on our website www.saturdays.ai Join us!
A history of the Saturdays.AI community. Originally published on Apr 6, 2022.
← More community stories