Classifying X-rays with machine learning: the project’s scope and limitations
COVID-19 is the disease caused by the new coronavirus known as SARS-CoV-2. The WHO first learned of the existence of this new virus on December 31, 2019, when it was informed of a group of cases...
A learning project shared by the community. The article documents its team, methods and results; it does not establish that the prototype is ready for real-world use.
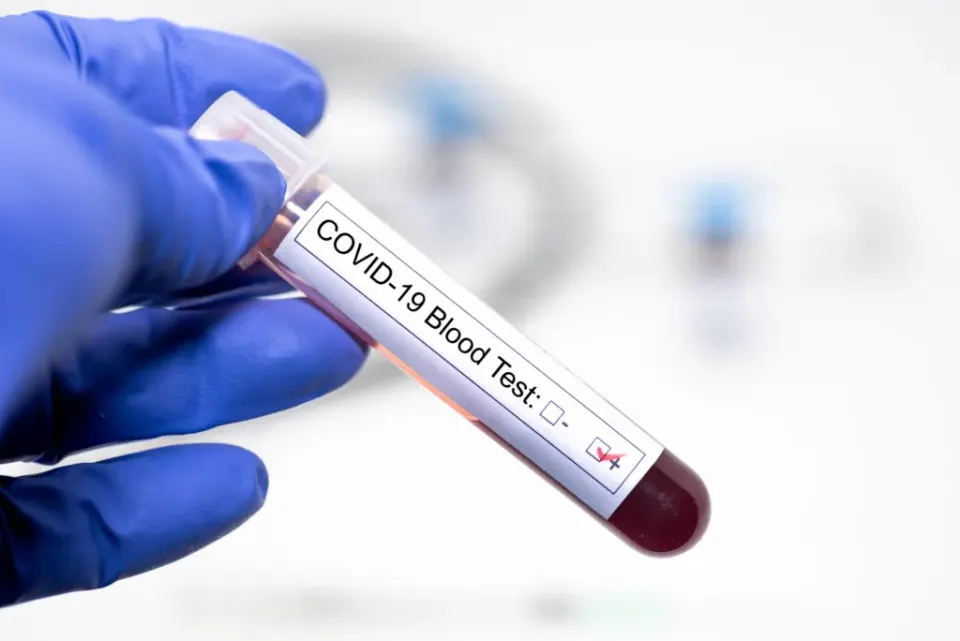
Editorial note: this article documents an educational project and its results on the data used. It does not establish clinical validation or authorisation to diagnose or treat patients. Proposed healthcare applications are retained as the team’s goals, not demonstrated capabilities.
COVID-19 is caused by the SARS-CoV-2 virus. This project began during the pandemic with the aim of exploring machine learning for X-rays. However, the dataset used distinguishes normal images from pneumonia, not COVID-19 cases. We therefore present the work as an educational image-classification experiment.
It is called SARS-CoV-2, for the acronym:
- “SARS” because it can cause “Severe Acute Respiratory Syndrome” (SARS).
- “CoV” because it is a coronavirus.
- “2” because a similar virus already existed in 2002–2003 that also caused SARS.
WHAT TESTS ARE USED TO DIAGNOSE COVID-19?
PCR
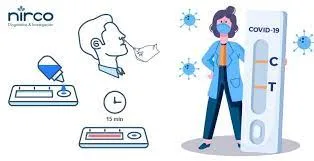
PCR, short for polymerase chain reaction, is a technique long used in tests for infectious diseases. During the pandemic, it was used to detect SARS-CoV-2 genetic material. Rapid antigen tests use a different method and provide results more quickly.
ANTIGEN
Antigen test. This COVID-19 test detects certain proteins on the virus. A swab is used to take a sample of fluid from the nose, and antigen tests can give results in minutes.
CHEST X-RAY
Scans or x-rays produce an image of the organs and structures (heart, lungs, and airways) in the chest. They can detect blockages, inflammation and excess fluid.
- X-rays use a small amount of radiation to produce a two-dimensional image. They are usually done by a radiologist in the hospital using stationary equipment, but they can also be done with a portable machine.
- Computed tomography (CT) uses a computer to merge several x-rays taken from different angles to produce a two-dimensional image that can be converted to a three-dimensional image. It requires very specialized equipment and is performed in the hospital by a specialist radiologist.
They can be done in a hospital or other healthcare facilities, such as a doctor's office or clinic.
PROBLEM
The project began in 2021, when access to COVID-19 testing was limited. The team wanted to explore X-ray analysis, but the data used do not support presenting it as a diagnostic alternative for that infection.
X-RAY IMAGES
X-rays and CT scans are frequently used in the medical field to diagnose pneumonia, lung inflammation, abscesses, and/or enlarged lymph nodes. Since COVID-19 attacks the epithelial cells that line our respiratory tract, we can use x-rays to analyze the health of a patient's lungs.
The availability of X-ray equipment motivated the team’s initial question: could image analysis help during the pandemic? That question must be distinguished from what the prototype actually evaluated.
OBJECTIVES
- Compile model inputs into datasets for training, testing, and validation.
- Develop an experimental X-ray classifier using deep learning and study its limitations.
- Evaluate the results of the model through the confusion matrix.
MODEL DEVELOPMENT
The model used the “Chest X-Ray Images (Pneumonia)” dataset from Kaggle. The team reports working with 5,856 images. Its labels distinguish pneumonia from normal images, not COVID-19. Having pneumonia does not mean having COVID-19, so the following results evaluate that classification rather than SARS-CoV-2 detection.
https://www.kaggle.com/paultimothymooney/chest-xray-pneumonia
MODEL SELECTION AND IMPLEMENTED TECHNIQUES
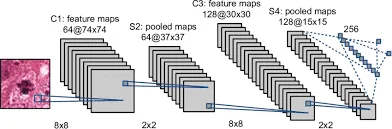
We used convolutional neural networks, an architecture widely used in image-processing tasks, to build the X-ray classifier.
Convolutional networks contain several hidden layers, which are responsible for detecting lines and curves and thus with convolutions it will be possible to detect more complex shapes such as silhouettes, faces, etc.
We used TensorFlow and Keras. TensorFlow provides tools and libraries for building machine learning models, while Keras offers a high-level API. In the environment used for this project, Keras was integrated into TensorFlow.
PROJECT DEVELOPMENT
As this was a proof of concept for an introductory deep-learning course, we stored the images in Google Drive and developed the classifier in Google Colab.
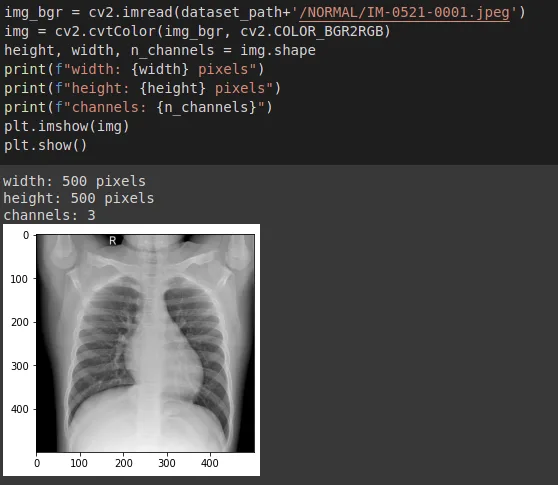
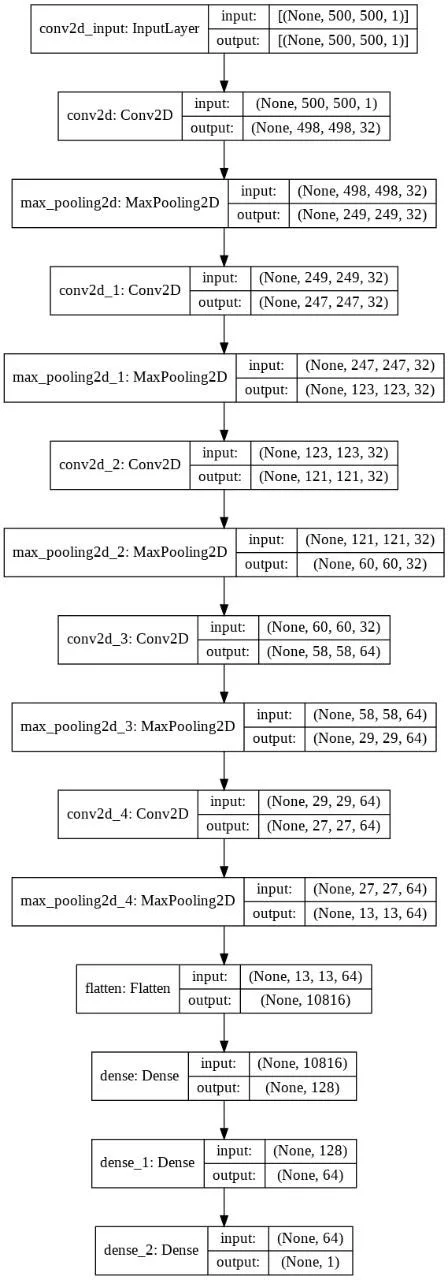
The images were adjusted to a size of 500×500, to be able to train. The following image shows an x-ray of a normal patient.
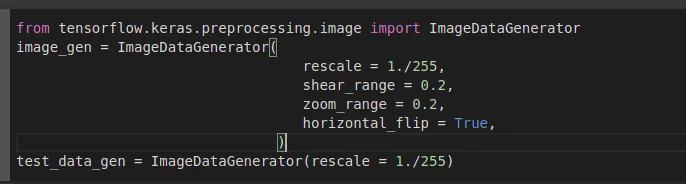
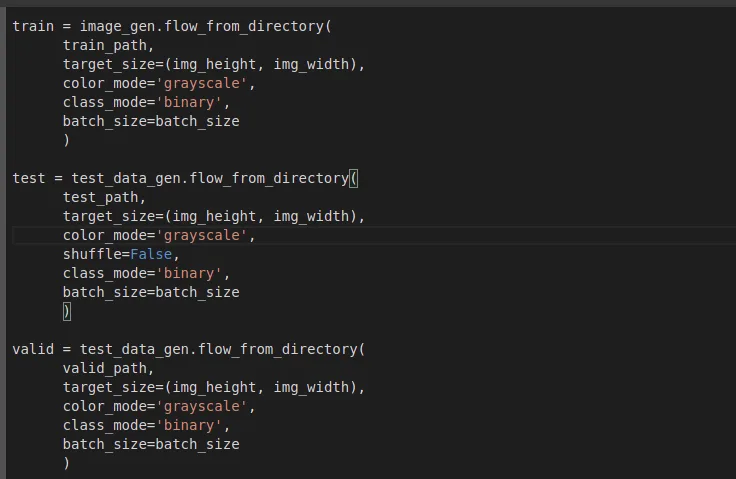
With the integration of Keras with Tensorflow, there are new classes such as “ImageDataGenerator” that facilitate the loading of images:
The images were divided into 3 groups: training, testing and validation.
The classification model can be seen in the following graph:
MODEL EVALUATION
To carry out the evaluation, the confusion matrix was used:
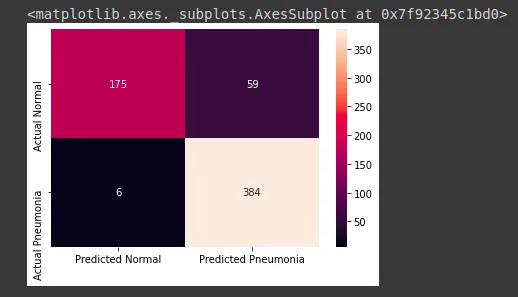
Where you can see that the model has identified:
- 175 true negatives (TN): images without pneumonia classified as negative.
- 384 true positives (TP): images with pneumonia classified as positive.
- 59 false negatives (FN): images with pneumonia classified as negative.
- 6 false positives (FP): images without pneumonia classified as positive.
With this data we can calculate the following indicators:
Accuracy = (TP + TN) / (TP + TN + FN + FP)
Accuracy = (175 + 384) / (175 + 384 + 59 + 6)
Accuracy = 0.8958
Accuracy is the proportion of all predictions that were correct: 89.58%.
Precision = TP / (TP + FP)
Precision = 384 / (384 + 6)
Precision = 0.9846
Precision is the proportion of positive predictions that were correct: 98.46%.
Sensitivity = TP / (TP + FN)
Sensitivity = 384 / (384 + 59)
Sensitivity = 0.8668
Sensitivity is the proportion of positive cases correctly identified, reaching a value of 86.68%.
Specificity = TN / (TN + FP)
Specificity = 175 / (175 + 6)
Specificity = 0.9669
Specificity is the proportion of negative cases correctly identified: 96.69%. The original version used FN instead of FP in the denominator; the formula and result are corrected here.
ANALYSIS OF RESULTS
The confusion matrix gives an accuracy of 89.58% for the evaluated images. This does not establish clinical validity or performance on other datasets.

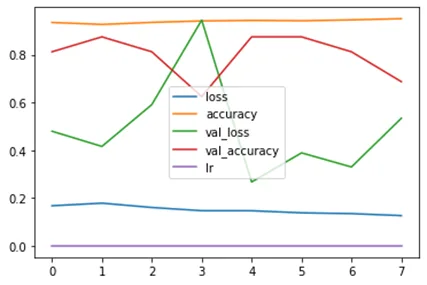
In the training plot, accuracy remained above 80% and loss below 0.2. Loss is the value of an error function, not a percentage of incorrect diagnoses.
CONCLUSION
According to the results obtained, we have:
- The classifier achieved approximately 89.6% accuracy on the evaluated data.
- The exercise provides experience in X-ray classification but does not demonstrate an ability to diagnose COVID-19. Any healthcare use would require suitable data, independent validation and clinical oversight.
BIBLIOGRAPHY
How do PCR and rapid coronavirus tests work and how are they different?
https://bootcampai.medium.com/redes-neuronales-convolucionales-5e0ce960caf8
Detecting COVID-19 in X-ray images with Keras, TensorFlow, and Deep Learning
https://www.kaggle.com/ankitachoudhury01/covid-patients-chest-xray
https://www.juanbarrios.com/la-matriz-de-confusion-y-sus-metricas/Saturdays.AI
Saturdays.AI
Written by
Bladimir Calcina

Saturdays.AI
Saturdays.AI is an open community for learning artificial intelligence, collaborating and building projects with social impact.
A story from the Saturdays.AI community. Originally published on Jan 2, 2022.
← More community stories