HaPyness: Analysis of sentiments in the population of Aragon
HaPyness explores sentiment analysis in tweets associated with Aragón: dictionaries, machine-learning models, results and limitations.
A learning project shared by the community. The article documents its team, methods and results; it does not establish that the prototype is ready for real-world use.
Zaragoza. First Edition. 2022
¡How our lives have changed in recent years!
A global pandemic, the attack on the US Capitol, Storm Filomena, a volcanic eruption and the outbreak of war in Europe… and, amid it all, an AI course in Zaragoza. That was the backdrop to this project in 2022.
One windy Friday afternoon, three intrepid Zaragoza residents began our journey in this area.
We are the team Aragón Feliz, we come from different worlds, but we share a common interest in Artificial Intelligence, and we seek to expand and apply the knowledge acquired during the program. Saturdays.AI. The team is made up of:
Fernando Jiménez
Héctor Soria
Virginia Navarro
And thanks to the help of our mentors of the program Saturdays.AI, who have given us the basis, we have been able to undertake this project.
When Saturdays AI-Zaragoza asked us to develop a project based on AI, we asked ourselves several questions.
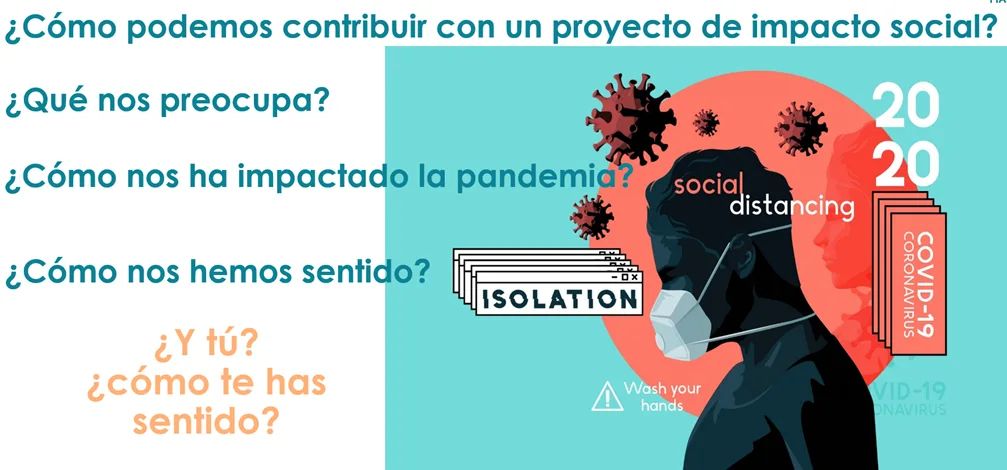
And the Covid-19 health contingency has caused exceptional circumstances with a high impact on society, massive confinement, loneliness, uncertainty, economic, health and social crisis, which has generated different types of reactions in the population, increasing the present pathologies, both physical and psychological, economic problems, among others.
Some data
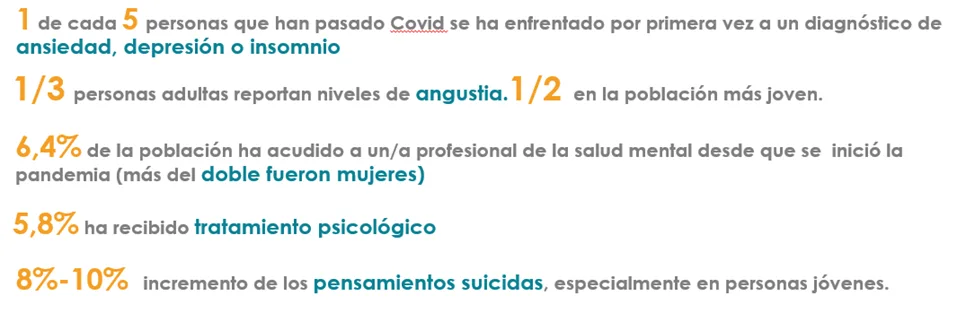
According to the Confederation of Mental Health Spain in the #saludmentalvscovid19 study (https://consaludmental.org/centro-documentacion/salud-mental-covid19/)
Source consaludmental.org
The data is clear, this whole situation has already had a high impact on society and will probably manifest itself even more over the coming years.
It concerns us personally, but… is it a widespread concern?
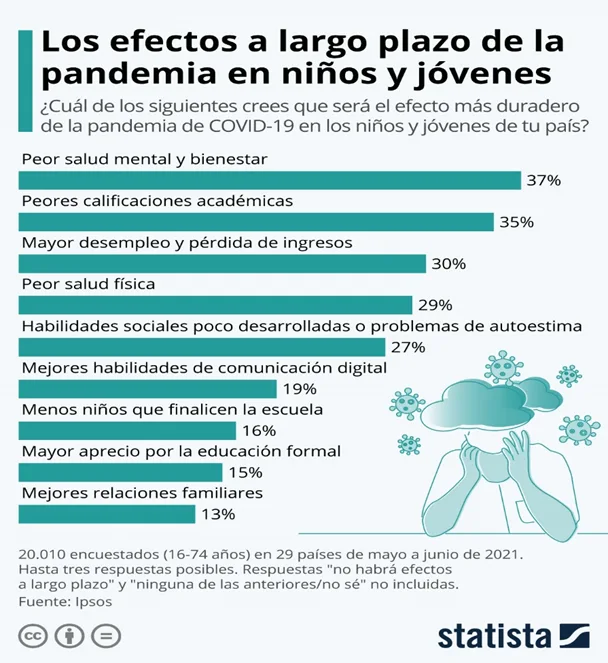
Different sources show that yes, it is an issue that is of concern in all age ranges, let's see for example this survey carried out on a younger profile.
Source statista
But what could we do? How could we reverse this effect? How could we tip the balance towards the other opposite pole: Happiness?
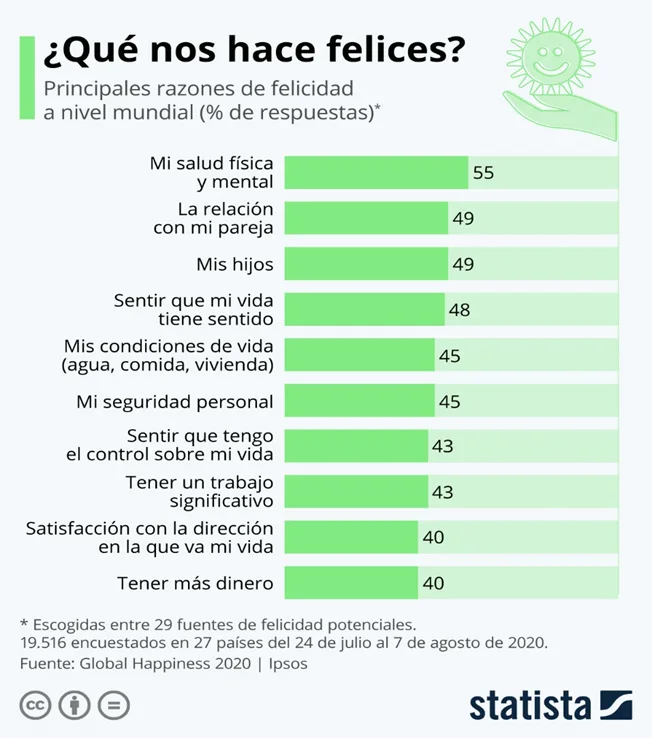
To begin with, what is Happiness and how do we achieve that Happiness? What makes each of us happy?
According to this survey we can see what specific aspects are valued when thinking about Happiness.
Source statista
These were the following questions we asked ourselves:
How were we before?
How were we during the highest peaks of the pandemic?
How did that state change as the waves of the pandemic unfolded?
How are we really now?
Ultimately…
How do we become aware of the emotional journey we have suffered?
How have we expressed it through language?
But above all...
How do we translate it into something measurable that we can analyze?
Are we able to anticipate and, through words, detect states and launch possible alerts that, with the proper tools, facilitate change?
What is the problem to be solved?
Our first approaches
With all the previous questions we were aware of the magnitude of the problem we were considering.
To begin with, how were we going to be able to measure all this? Is it possible to generate some indicator and timely information about the emotional impact on people and how they, consciously or unconsciously, reflect it through their language?
Can we use sentiment-analysis and topic-analysis algorithms to identify concerns related to the pandemic or other situations affecting people?
One of the main challenges is interpreting language. Natural language processing (NLP) offers many techniques, but in this 2022 project we struggled to find Spanish-language resources suited to our context and labels.
Well, after all this reflection, this was then going to be our initial challenge.
Problem
Against the backdrop of the pandemic, we set out to explore changes in the language of comments associated with Aragón on social media and other outlets, both overall and on specific topics. Text analysis cannot directly measure the psychological wellbeing of the entire population.
Maybe too ambitious?…
Maybe so, so we tried to limit our scope and from there evaluate if it was viable to do it, so we focused on the following problem.
Bounded problem
There is a high complexity when making a sentiment analysis (need for manually labeled datasets by experts, time to perform this manual annotation, the ambiguity of language and subjectivity of emotions, impact of the language with which we are going to work and high risk of errors). Being aware of this complexity, we developed our main objectives.
What is our objective?
Realistic goal
Provide society with a tool that gives a classification or automatic labeling of text to make manual review less complex, facilitate this work and help identify ambiguities and errors.
Demonstrate that the tool is viable and develop all the methodology necessary to achieve this automatic labeling.
Our ambitious goal
Develop a model that analyzes the evolution of citizen sentiment in Aragon regarding different themes (extracted from the context itself or predefined based on a standard categorization), taking into account different sources such as social networks, press, etc. And based on the analysis carried out, which make recommendations and provide tools in order to mitigate the negative impact on your emotional state.
Available to the general public, public organizations and the media.
Objective with Social Impact
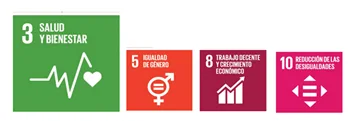
Our guiding axis is included within the Sustainable Development Goals, specifically in 3. Health and well-being, although being so broad it has an impact on many more objectives.
Let's get to work. Project Development
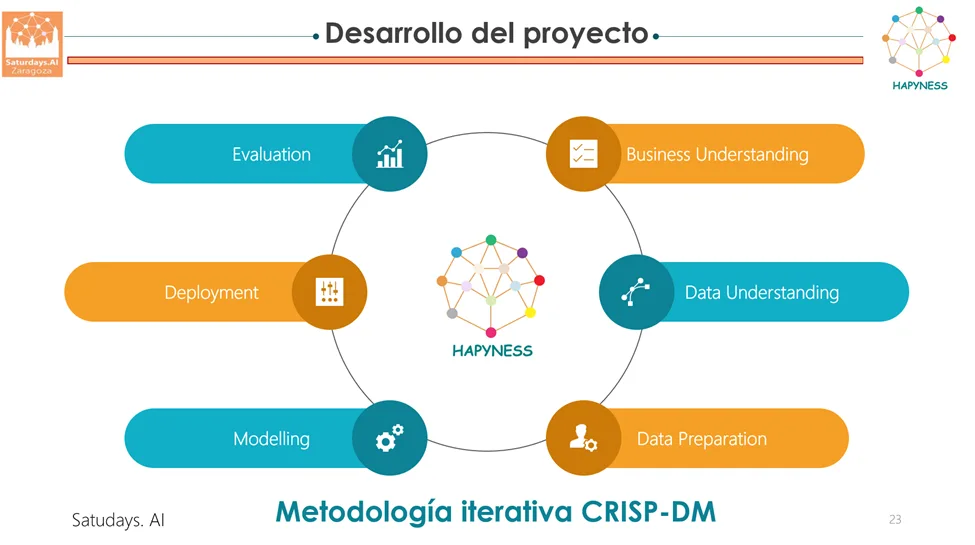
For the execution of the project we have followed the following iterative methodology based on the CRISP-DM standard (Cross Industry Standard Process for Data Mining).
Phase I. UNDERSTANDING THE PROBLEM
At this point in the project, we work on the identification of resources, restrictions, problems and processes involved.
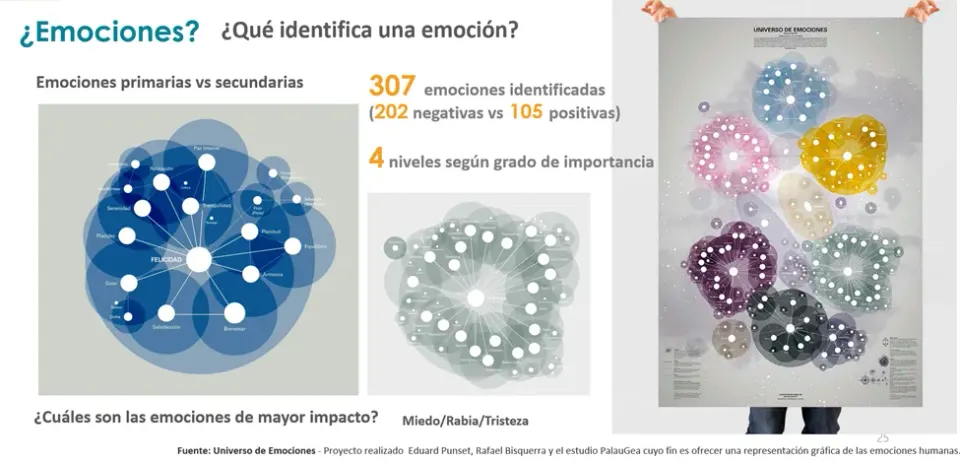
As we have been commenting, without a doubt the pandemic period has been a stage of high emotional impact, but in this very global concept, do we all understand these emotions in the same way?
We start with emotions
Source Universe of emotions
Language problems
We will work on written texts, so we began to consider what possible problems we could encounter when managing and analyzing this type of information.
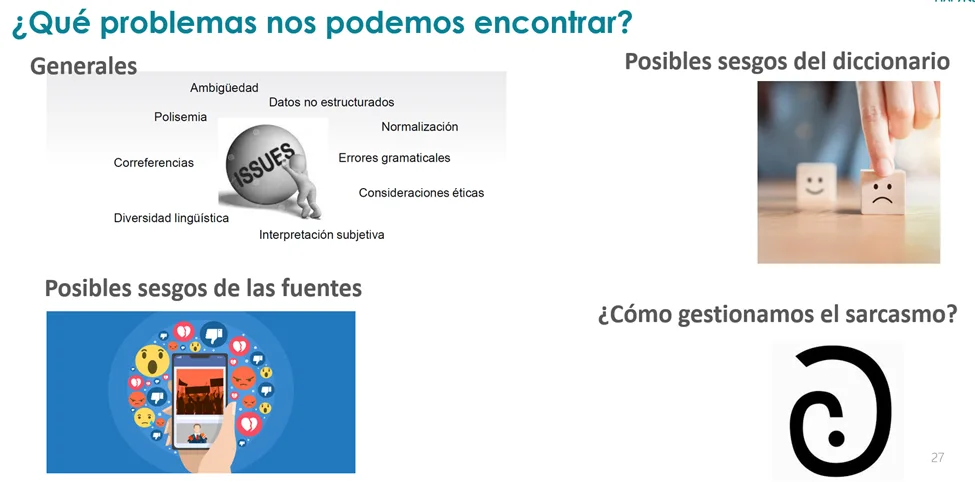
The model would need to account for phenomena such as irony, negation and context. Recognising them was an aspiration for the project, not a demonstrated capability of our tool.
As a final reflection, based on all of the above, we saw clearly the difficulty in extracting emotions from texts, which led us to consider building our own dictionary and, as a first approach, considering a semi-automatic classification algorithm.
Phase II. UNDERSTANDING THE DATA
And we continue with data, the workhorse of all projects.
A. Data sources and problems in obtaining them
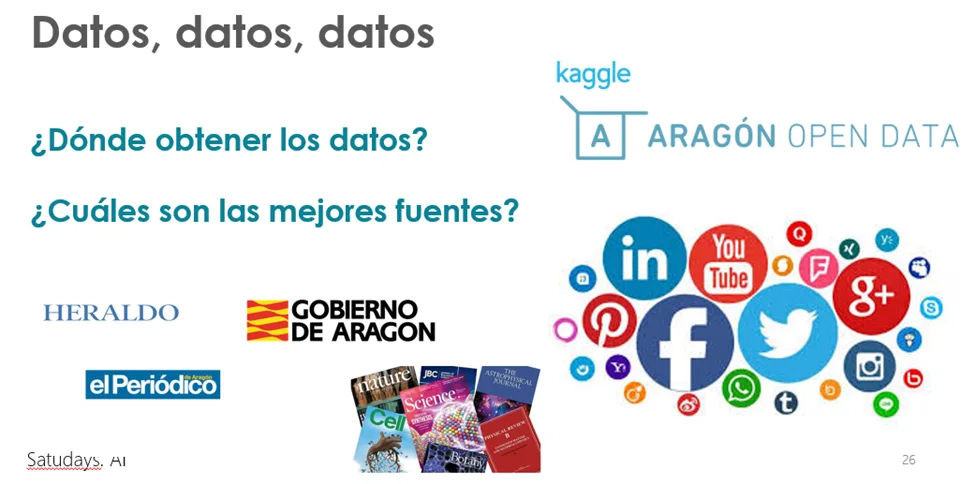
We did not have a labeled dataset specific to Aragon and the pandemic and we considered how to solve the problem without using texts from other areas and periods. But, even so, the available ones have been used to make a qualitative comparison of our solution.
We found different data sources that could be useful to us and we were browsing them to see which could be most valuable to us, since we needed a previously categorized dataset.
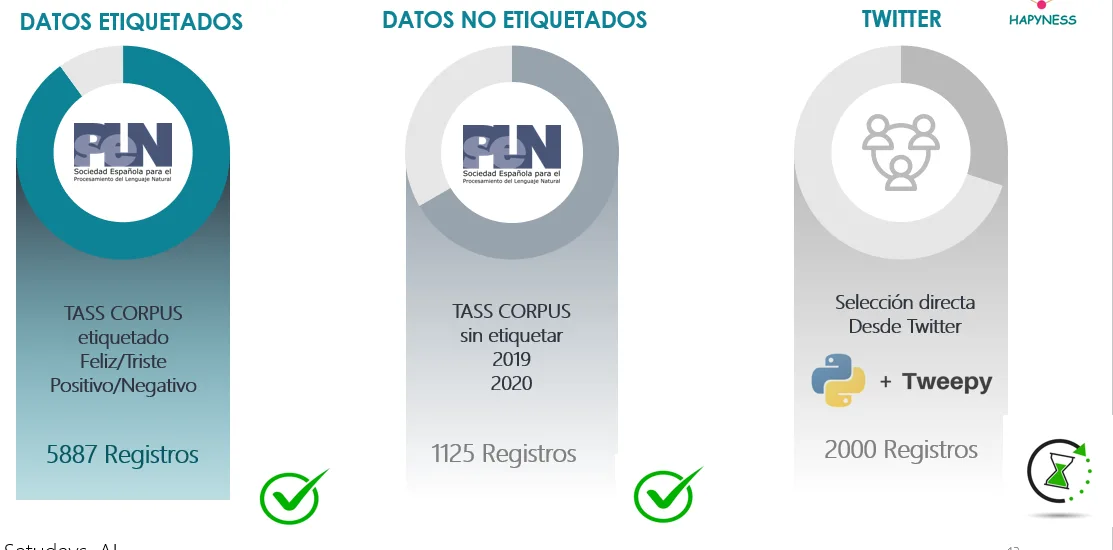
Labeled data
Initially we use the corpus of TASS, so we go to the Spanish Society for Natural Language Processing (SEPLN), through which the TASS, a workshop on sentiment analysis in Spanish. http://tass.sepln.org/
The folder with the data was requested from the organization and we were granted permission to use it.
When reviewing the data, we found tweet files grouped by country and year, with different labelling schemes depending on the edition of TASS . Some indicated polarity (positive, negative or neutral), while others included emotion categories. We reviewed these differences before comparing them.
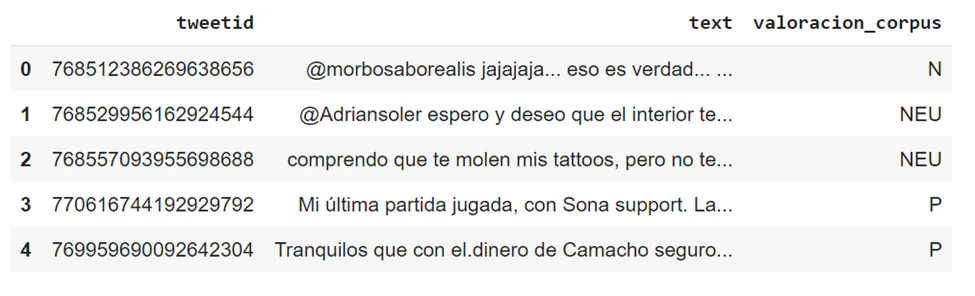
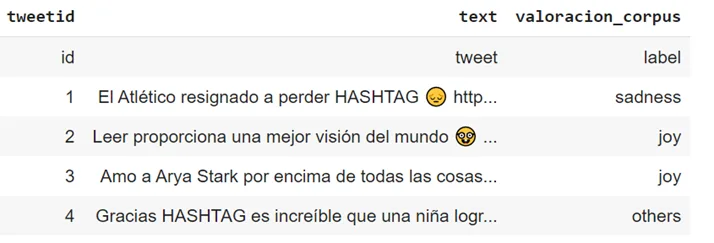
The corpus files are in XML format, which we have processed and adapted so that our model understands it, transforming the data into a .csv format, “Comma Separated Values”, to be able to proceed with the next phase.
Unlabeled data
Regarding the data to evaluate the model, we followed two paths:
1) On the one hand, we used the test data from the Corpus TASS, whose file structure is similar to this:
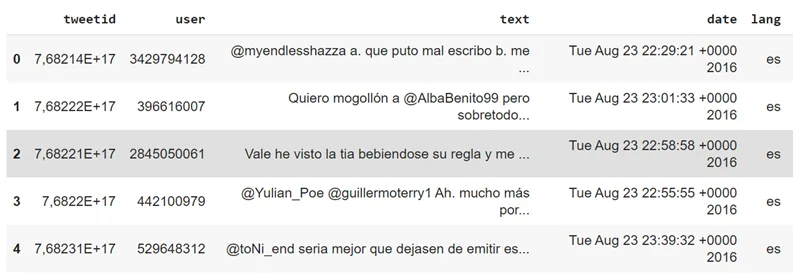
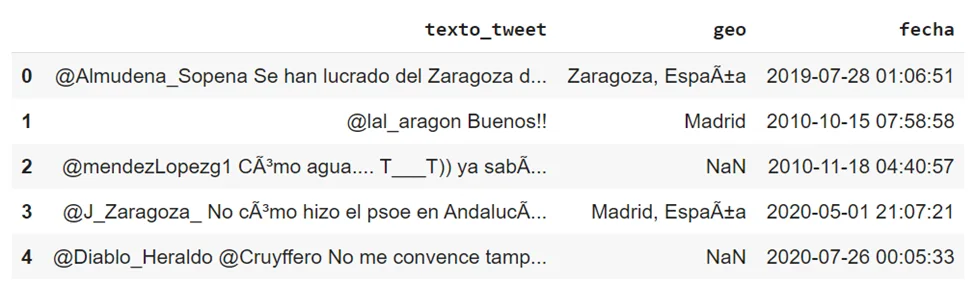
2) and on the other hand we collect data directly from Twitter thanks to the tool Tweepy which allowed us to search for user publications on this social network through its API, during the pandemic period. The selection of publications was carried out with the following criteria: Aragon, covid, date, geolocation,…
To be able to do this process, we create a Twitter/developer account to start downloading the tweets.
We use this article as a reference:
It took a while to give us access, but we finally got it and were able to continue advancing in this part.
The file structure is similar to this:
B. Features we wanted to consider
And we begin to consider what variables could be relevant in our study to help us achieve our goal (although we probably do not have all of them).
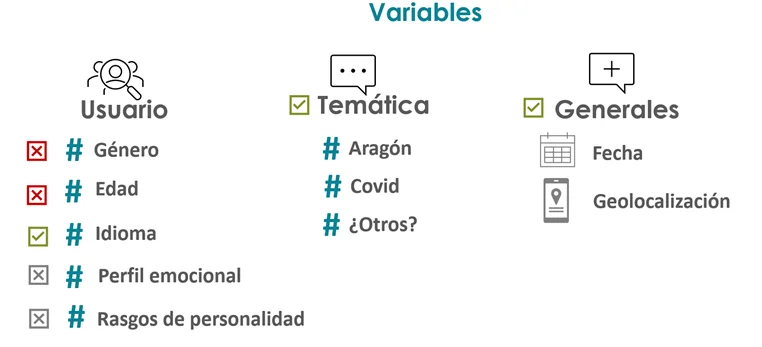
Phase III. DATA PREPARATION
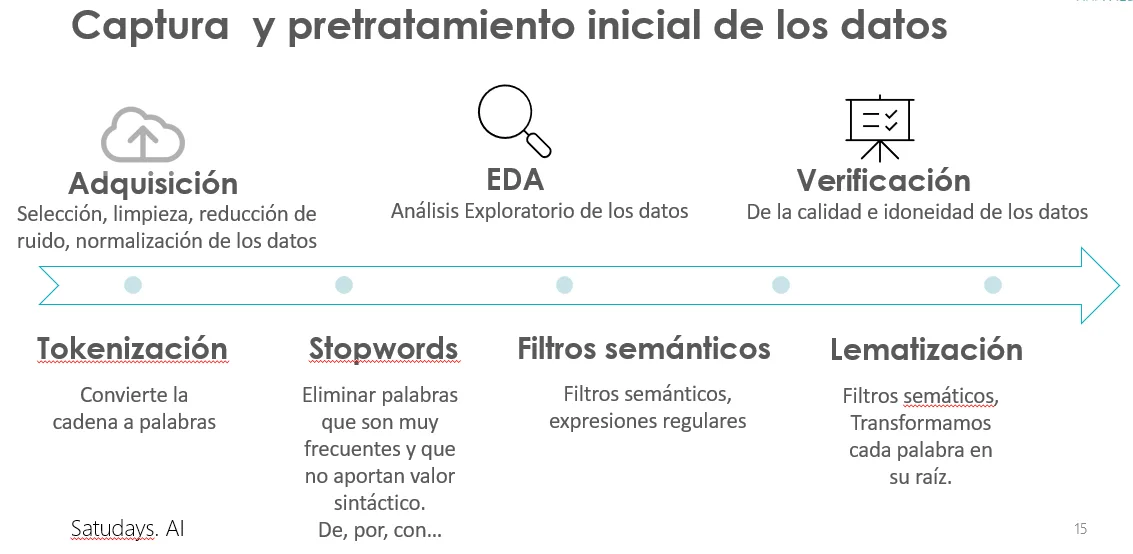
- Exploratory Data Analysis (EDA)
For our analysis, the initial dataset has the following description:
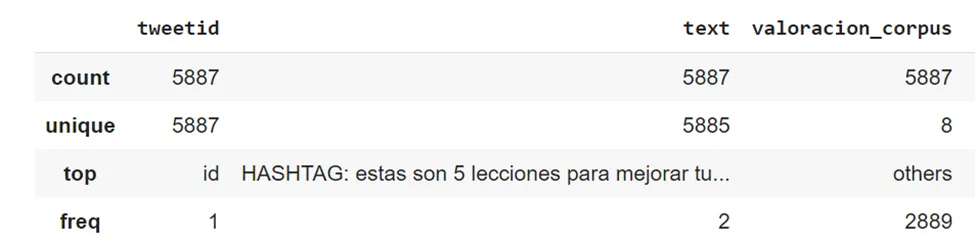
As we have mentioned, the corpus contains multiple levels of polarity. However, there are differences between different files, for example some files only have the levels Positive, Negative and Neutral, while others include an additional level called None. For our experiment, we chose to use a binary classification (Positive=1, Negative=0).
We started with positive and negative examples and mapped them to the dictionary’s “happy” and “sad” labels. This was a methodological simplification: the polarity of a text is not the same as its author’s emotional state, and neutral categories should not be arbitrarily converted into positive or negative ones.
- Data pretreatment and cleaning
Prior to analysis and modeling we need to do a noise elimination and normalization process.
We create the function limpia_tweet() that will eliminate stopwords and some peculiar characters from Twitter, later we adjusted this cleaning due to the noise of the data and the problems that the code was presenting to us.
1. Stopwords such as: de, con, por, …among others were eliminated.
2. Any type of mention, RTs, #, links, URLs was eliminated.
3. Any type of punctuation was removed.
4. We looked for abbreviations and internet slang, such as “u” for “you”, “ur” for “your” and “k” for the Spanish word “que”.
5. We removed emojis, numbers and symbols relating to currencies or percentages.
6. The data was explored, analyzing the most common words in the Tweets.
Once the process has been done, the clean text is stored in a new 'tweets_transform' column:
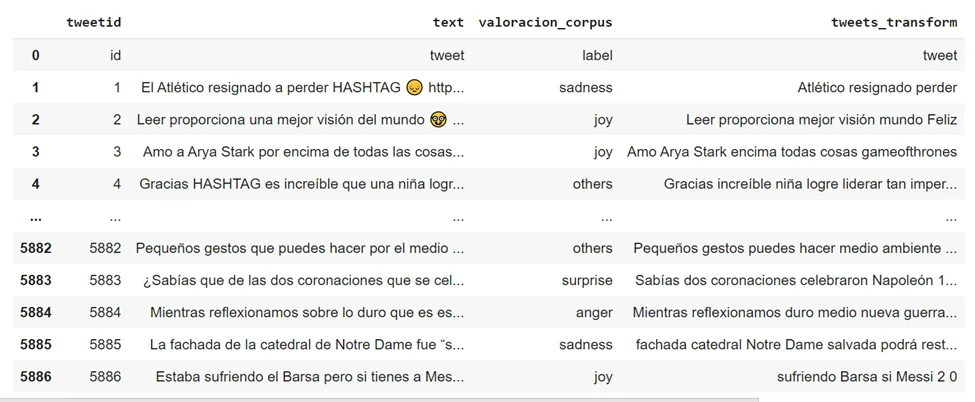
- Text processing
In order to be able to mathematically treat preprocessed tweets, we have to extract and structure the information contained in the text. To do this, we will use the class sklearn.feature_extraction.text.CountVectorizer.
CountVectorizer converts the text column into a matrix in which each word is a column whose value is the number of times that word appears in each tweet.
This way we can work with these vectors instead of plain text.
For each tweet we will carry out the following process:
1. Tokenization: This step converts a text string into a list of words (tokens)
2. Conversion to lowercase
3. Delete stopwords. Stopwords are frequent terms we chose to exclude for this task, such as the Spanish words “de”, “por” and “con”. Removing them can discard information, so this choice needs review.
4. Semantic filters Stemming reduces words to an approximate stem; lemmatisation maps them to their dictionary form. They are not the same procedure. For example, a stemmer may group the Spanish words “maravilloso”, “maravilla” and “maravillarse” by their shared stem.
5. Creation of a bag of words.
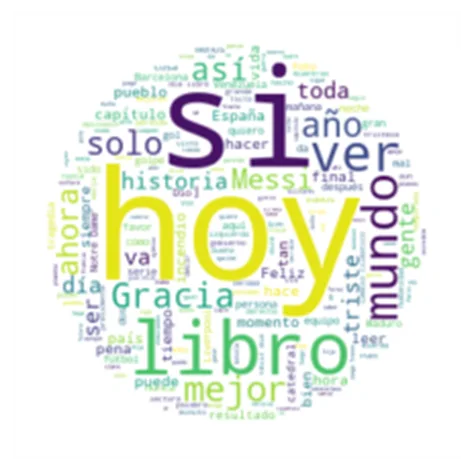
with WordCloud we visualised the most frequent words in the dataset:
- Data quality verification
We checked whether the data was sufficient, whether other variables such as date or geolocation needed processing, and whether we needed derived fields such as the sentiment score.
- Construction of a data structure for subsequent training and evaluation of the model
A. Geolocation data
B. Date: conversion to the format needed to plot changes over time.
Phase IV. MODELING
How can we address it?
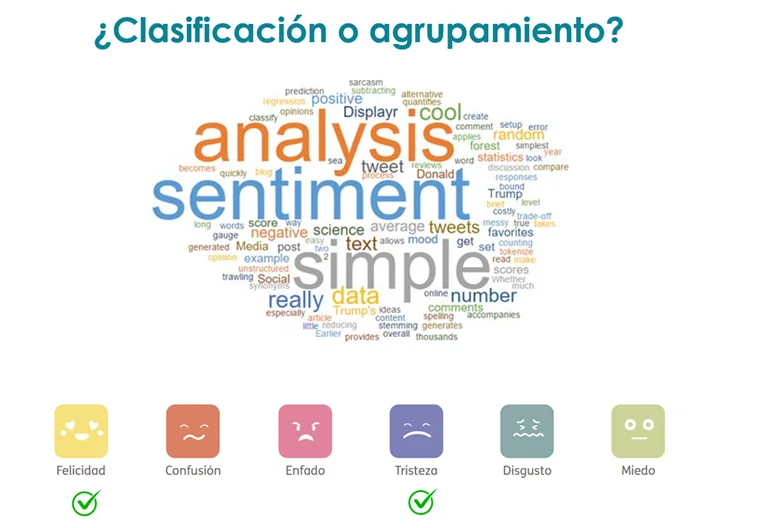
Variant 1: Solve the problem with classification techniques, specifically “sentiment analysis”, which has sentiment classes or labels: “positive”, “negative” or “neutral”. To do this, it will be necessary to obtain a data set with said tags that are related to Aragon (for example, Twitter data sets) or search for textual information (for example, regional newspapers, etc.) and previously classify them using sentiment tags (through a manual process, or automated using dictionaries).
Variant 2: Solve the problem by applying grouping techniques. In this case, it would be necessary to collect textual information (e.g. regional newspapers, Twitter, etc.) and group the information, and analyze these groups.
All the code and data used, in case you want to consult it in more detail, they are available in our Github repository: https://github.com/FJDevelop/HaPyness-Saturdays-AI
A. Dictionary-based scoring (rule-based classification)
Creating a dictionary
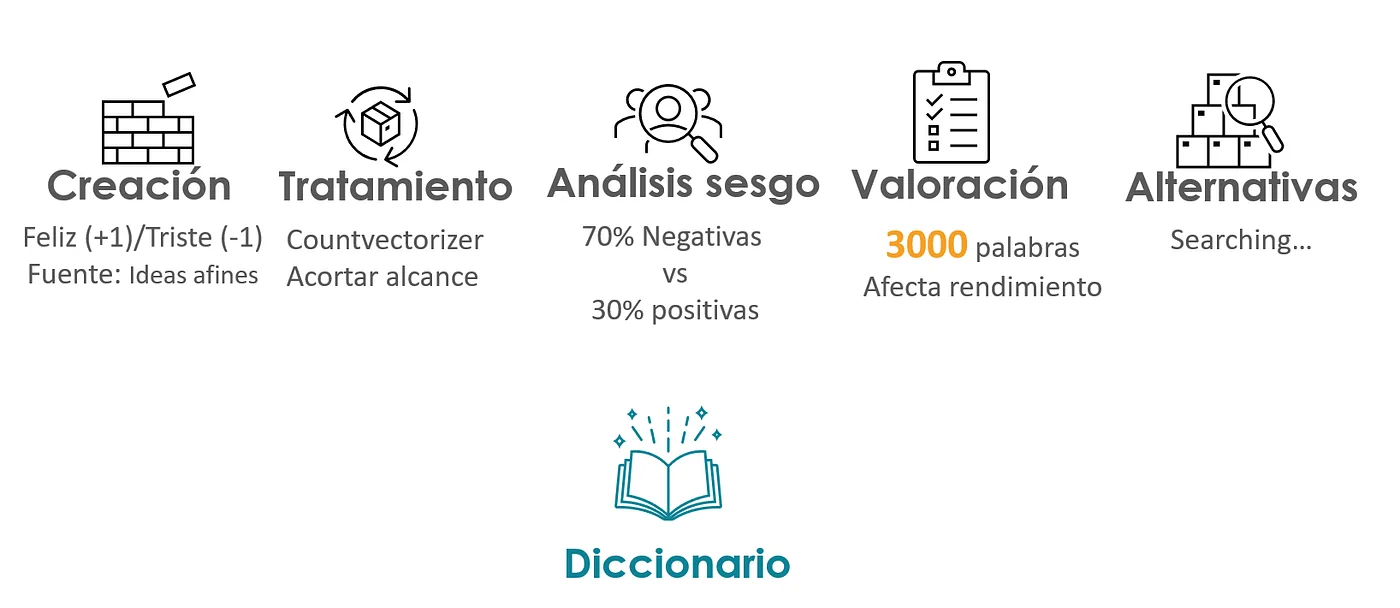
In order to be able to do this semi-automatic classification process, we needed to have a dictionary with which to compare and classify. Given the difficulty of finding one especially valid in Spanish, we decided to create our own dictionary, and these were the steps we followed:
- Dictionary Creation initial that allows us to detect the values Happy (+1) and Sad (-1), and thereby make an automatic assessment. Source: http://www.ideasafines.com.ar/buscador-ideas-relacionadas.php
- We examined the imbalance between positive words (30%) and negative words (70%).
- We carry out an assessment of the word volume 3000 (since it could influence us later on the processing and execution of the code)
- Search for alternatives. Assessment of the possibility of using a reduced dictionary.
- Decision on the final dictionary.
The dictionary initially contained 3000 words related to 'happiness' and 'sadness'.
After intensive post-processing and formatting, the vocabulary has been adjusted to 2600 words with as little ambiguity as possible.
The 3000 words have been reviewed manually to eliminate ambiguities and errors in assessment.
In generating this dictionary, following this reference document, which explains how to extract relevant features from a textual corpus:
https://www.geeksforgeeks.org/using-countvectorizer-to-extracting-features-from-text/
We use CountVectorizer: converts texts (= processed tweets) into rows, converts them to lowercase (but preserves the accents), and in each column the words used appear (their frequency in the sentence), in alphabetical order. The example shown here is very simple.
From the resulting object we can extract:
– A term dictionary, available in the vectorizer.vocabulary_ attribute after fitting.
– the matrix to analyze, with the frequencies (in a few simple steps)
Problem:
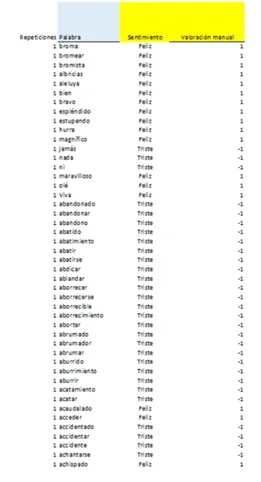
There were thousands of words and it took a lot of time, so, from the initial result, we decided to limit it to the most useful tabs (they are the yellow ones), enough for the “Happy/Sad” rating, since working with more values (Very happy, happy, sad, very sad) would involve much more development time and we wanted to advance in the rest of the methodology and evaluation of our solution. The input data to this process is shown below, where together with the manually prepared dictionary, the labeled corpus is analyzed and mapped to the Happiness/Sadness labels to complete the assessment vocabulary.
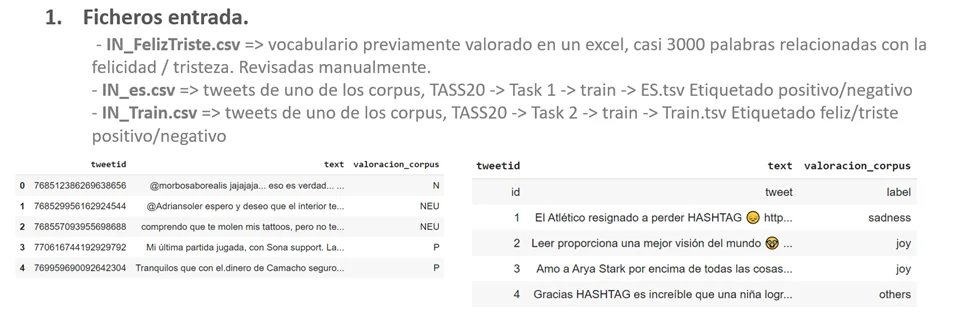
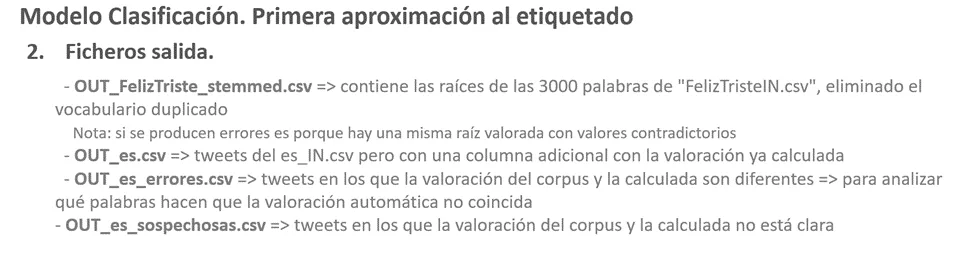
We create a model which executes the following algorithm:
a. Import the vocabulary.
Prepare Spanish stopwords from the vocabulary
Apply stemming functions.
b. Prepare the stemmed vocabulary
c. Read the tweets
d. Apply cleaning filters
e. Score the texts using the stemmed vocabulary and create a field for the calculated score.
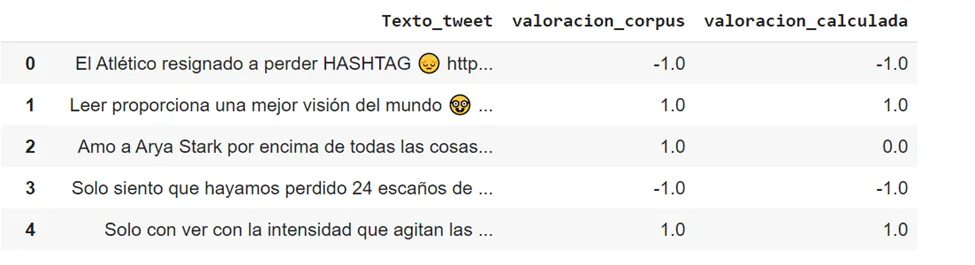
f. Save the evaluated tweets in different files according to the comparative result against the tagged texts (Ok, errors, suspicious)
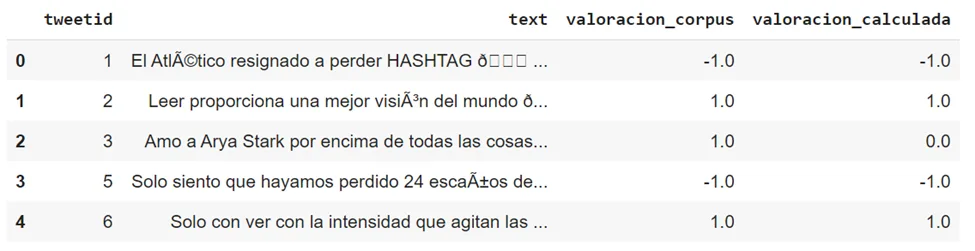
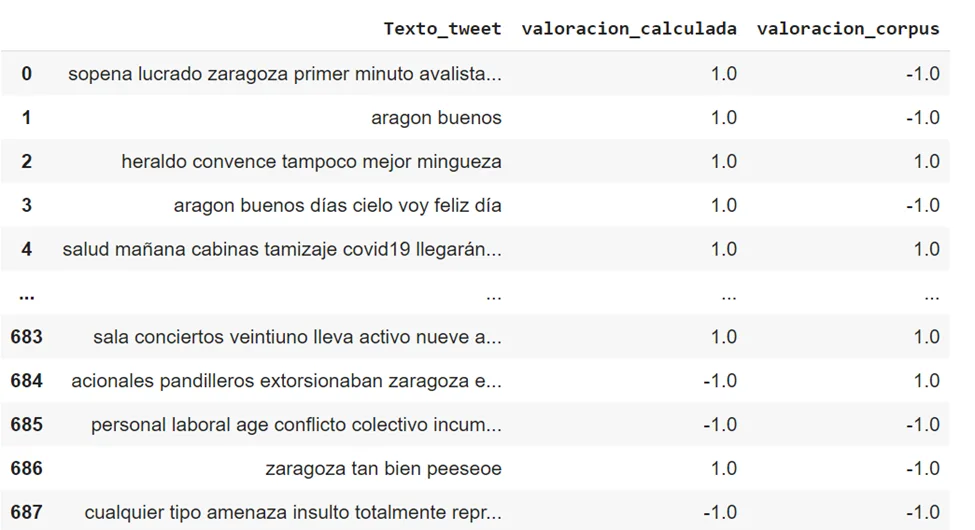
Example of comparison between semi-automatic and manual valuation
Regarding the file with the suspicious words, we performed an analysis to check if our process was working correctly.
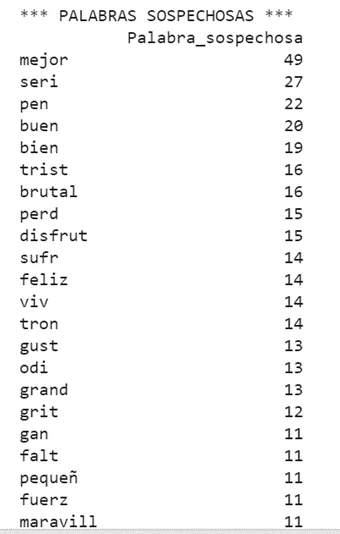
Suspicious words
We realized that the ones that appeared made some sense, if they were removed it seemed that it could get worse, so we would need to have another list of "interesting words" to look at before removing them, which represented a considerable additional effort, so we decided to address it later if we had time.
Without context, many words are ambiguous. With roughly 60% accuracy in that comparison, we decided to proceed with the OUT_es file and its Valoracion_corpus and Valoracion_calculada columns to explore machine-learning models.

B. Traditional Machine Learning models (supervised classification)
The objective of this Machine Learning problem is to predict the sentiment of the tweets included in our file using the TASS corpus as training data (data to train the predictive model).
It should be noted that the dataset has been divided into TRAIN and EVAL/DEV

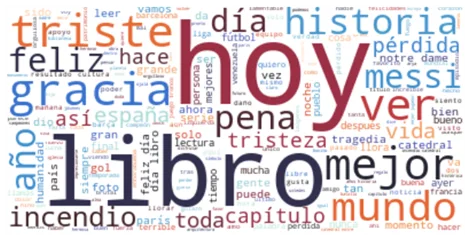
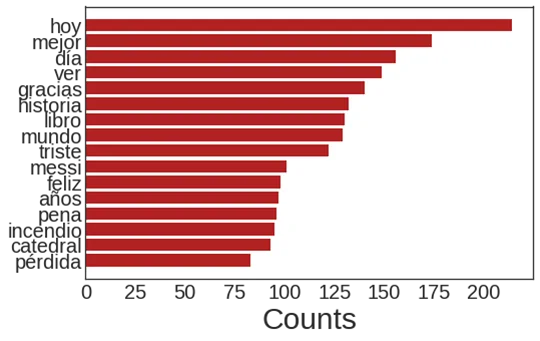
The 15 most used words before stemming
Numerical Representation
After stemming, we create a bag of words (Bag of Words, BoW), which is a representation of each document based on the unique words that appear among all available documents, from the union of all the phrases together with the number of times each word appears.
With the idea of compensating for those with a higher frequency, we apply TF-IDF (TermFrequency–Inverse DocumentFrequency), which tells us the relevance of a term in the document, taking into account the area in which it is usually used (corpus).
ML Algorithms Selection
Below we list the set of machine learning algorithms that we have considered in this phase (the original manual labeling as true classes has been used):
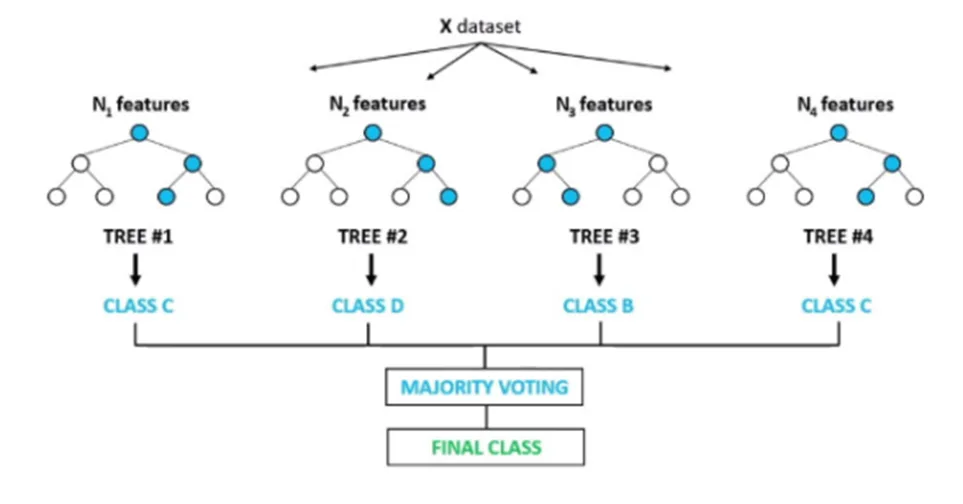
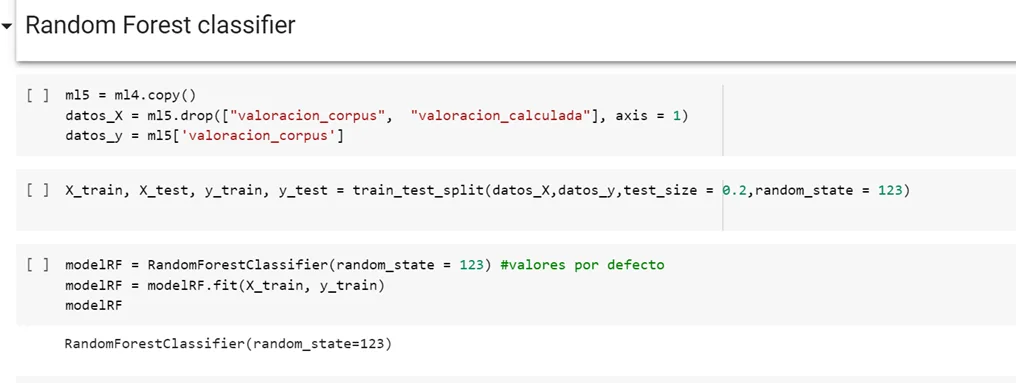
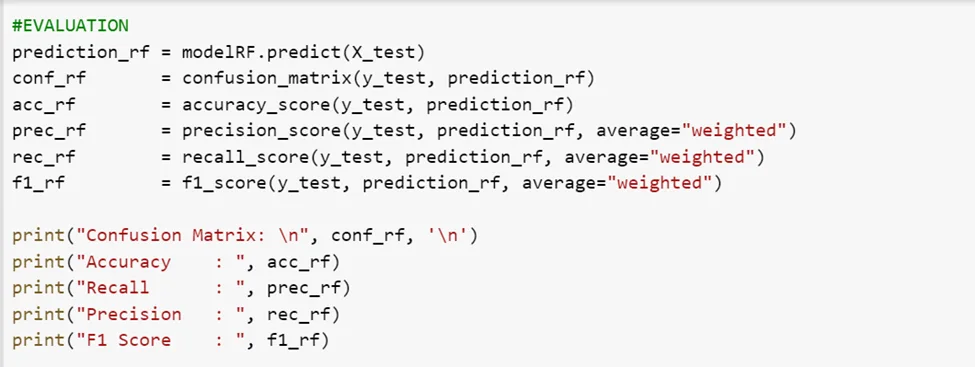
Random Forest Classifier
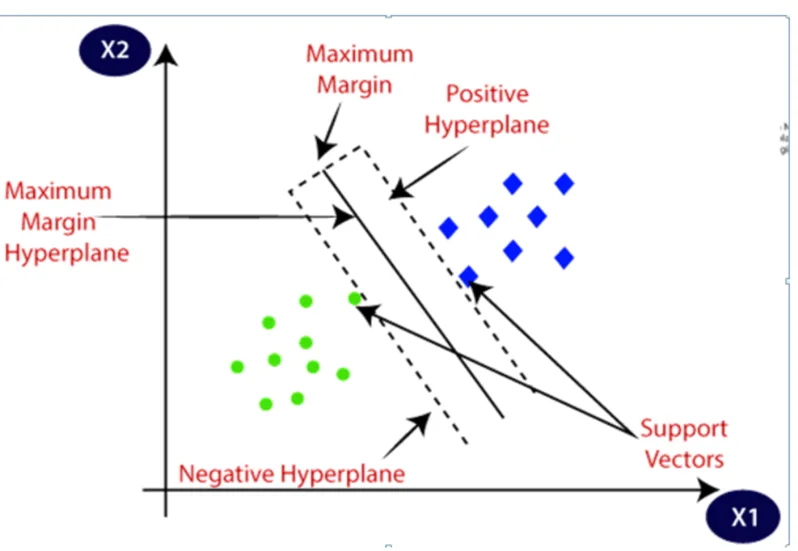
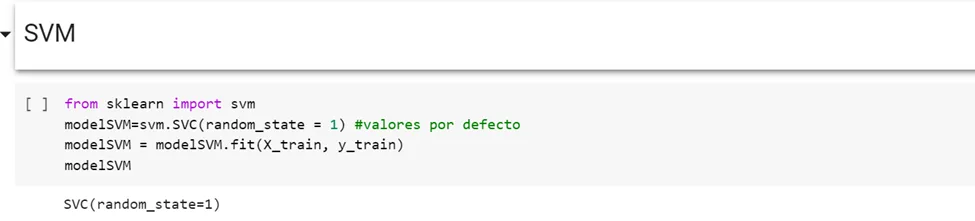
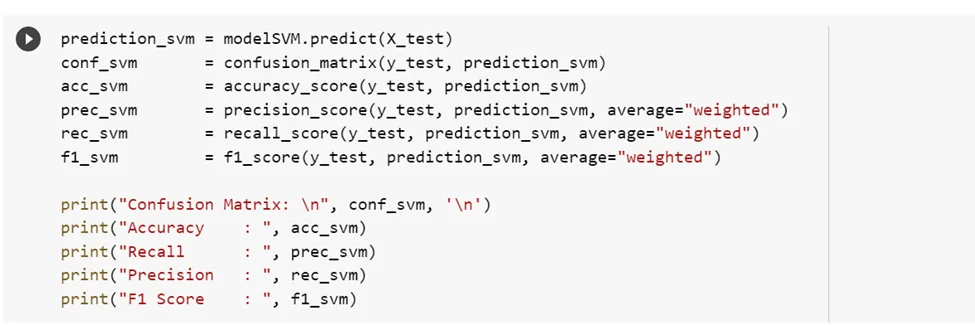
SVM
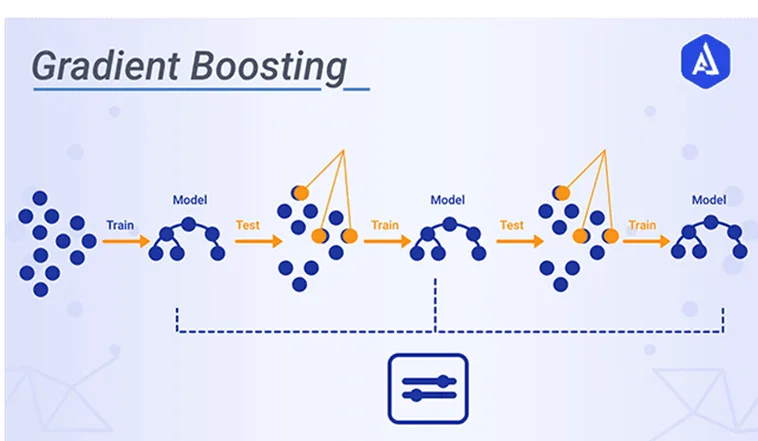
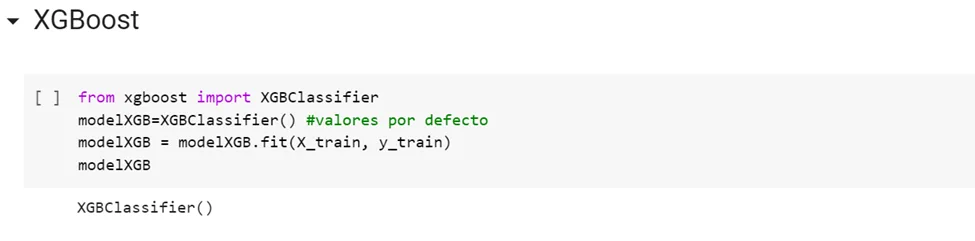
XGBoost
Application taking into account the Rating module
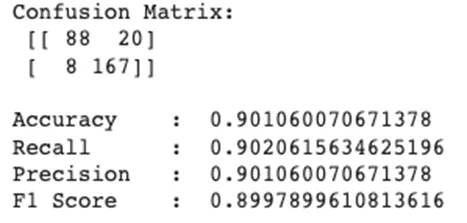
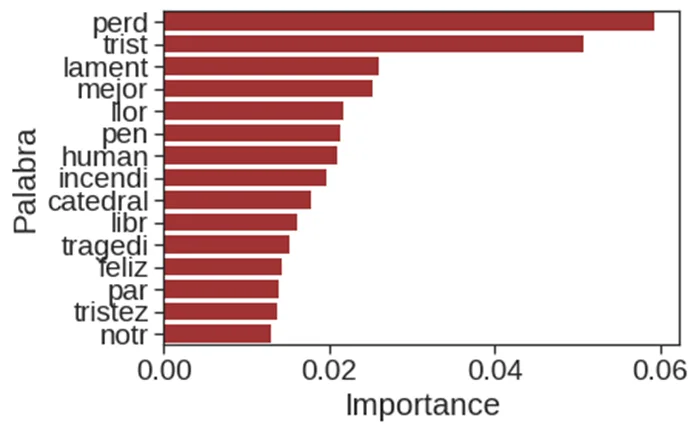
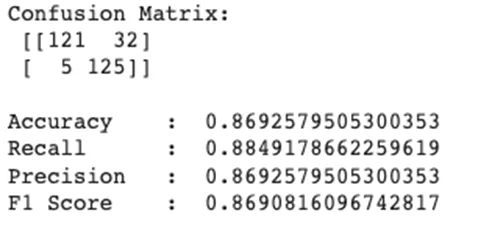
Random Forest
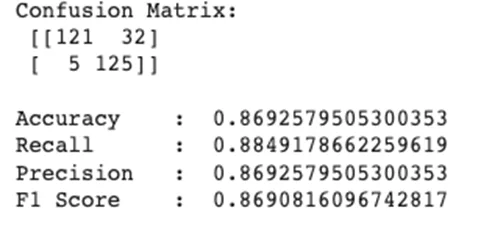
SVM
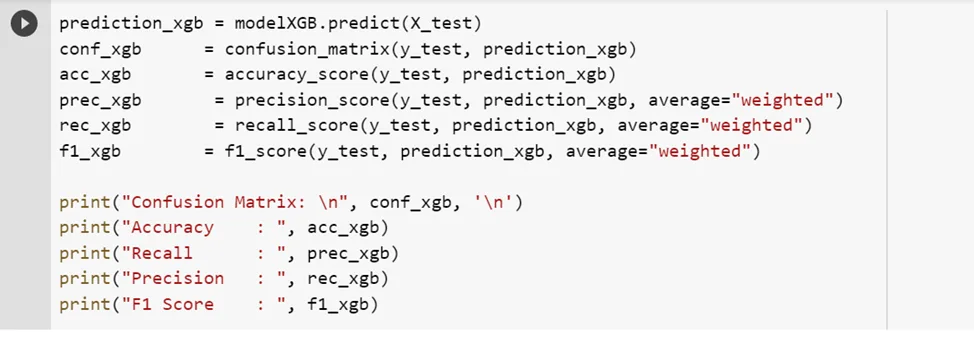
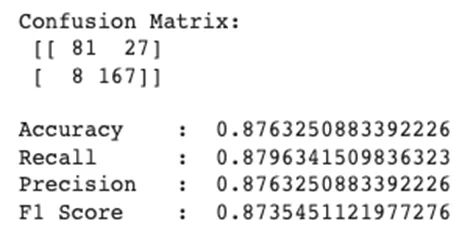
XGBoost
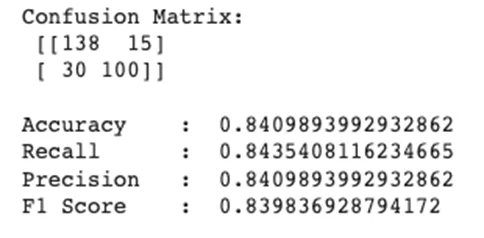
RF was promising in one comparison, so we tried GridSearchCV with both human and calculated labels. It did not improve results against human labels within the search we ran; this does not show that we had reached the best possible result.
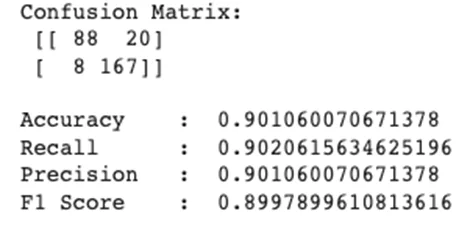
On the other hand, in the algorithmic assessment we managed to improve the result of the model, using the same quality parameters: Accuracy, Recall, Precision and F1.
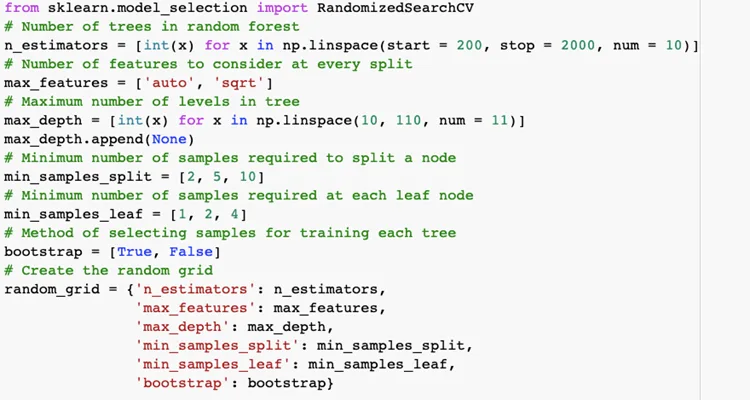
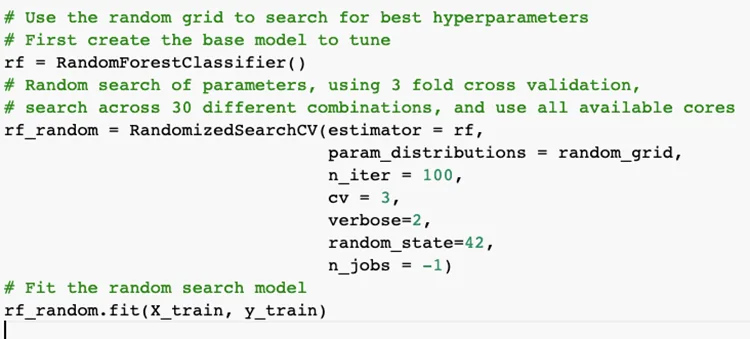
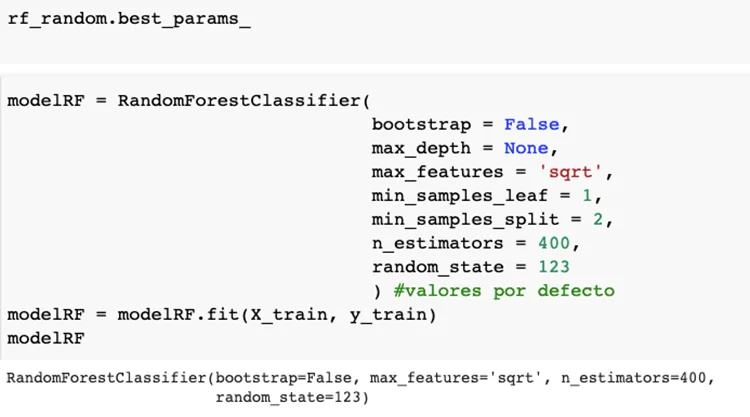
☝ We improved the result in this comparison! We saved the model to keep working.
C. Grouping…
We applied the Kmeans model, but the truth is that it was not very useful to us, we did not get very clear conclusions nor did we obtain very clear sets of terms, perhaps we could achieve better results by carrying out additional data cleaning work or perhaps have a greater volume of tweets to be able to draw conclusions.

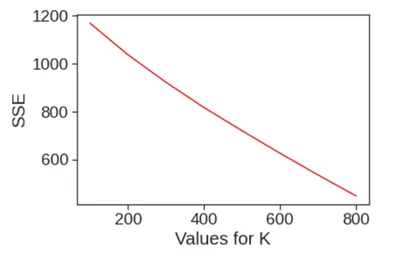
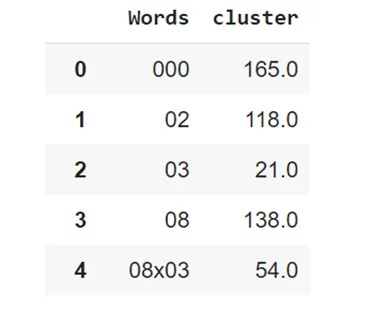
t-SNE: t-distributed Stochastic Neighbor Embedding
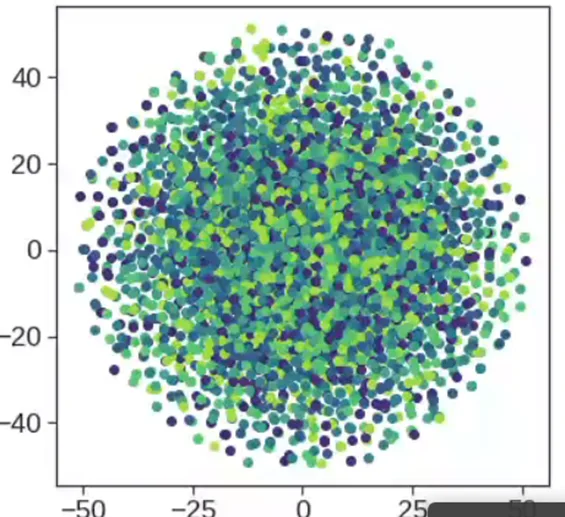
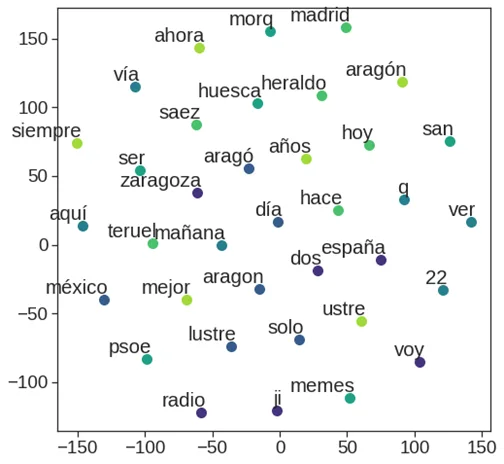
In order to visualize words in 2D we modify different parameters of the word2vec function. The ones that have the most influence on our system are the maximum number of words considered and the number of times a word has to be repeated in the text to be considered representative. As we can see from tsne's representation, it is difficult to draw conclusions. The text should be better cleaned to avoid dependency on accents or finish eliminating characters that only add noise such as 'ji' or 'san'.
D. Application on TEST data (unlabeled)
We applied the same steps to new tweets without manual labels to explore how the models behaved outside the original data. Comparing them with labels generated by our dictionary measures agreement between methods, not accuracy against an independent human reference.
We start from an exploratory analysis of the data and their pretreatment.
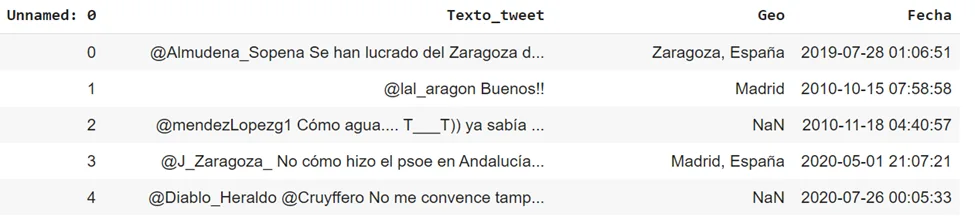
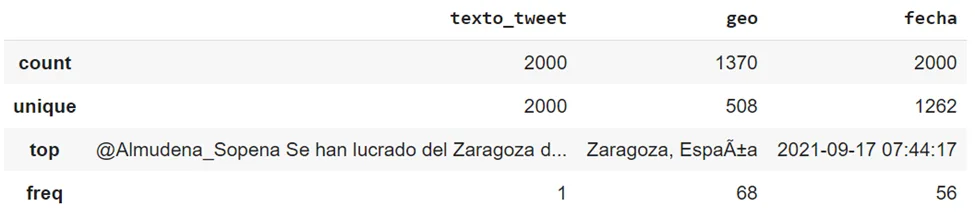
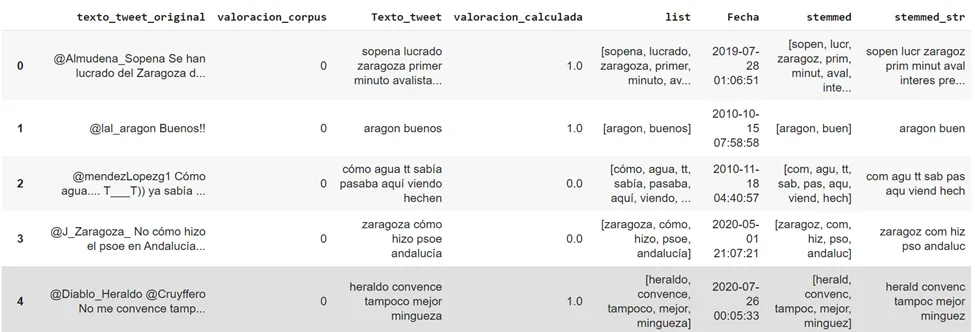
We see which are the most common words
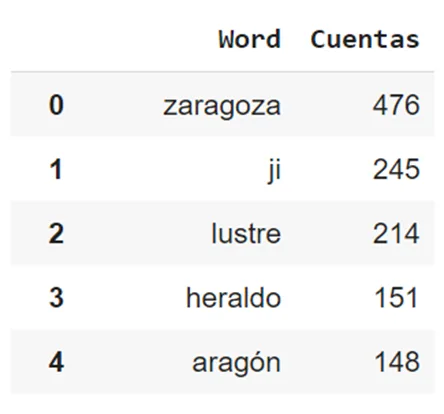
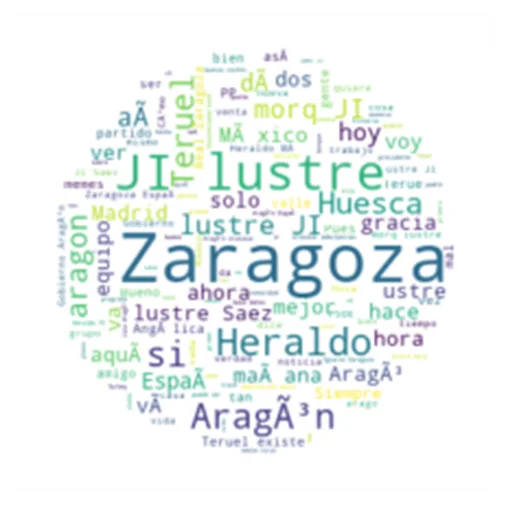
We apply the valuation module to obtain the calculated valuation:
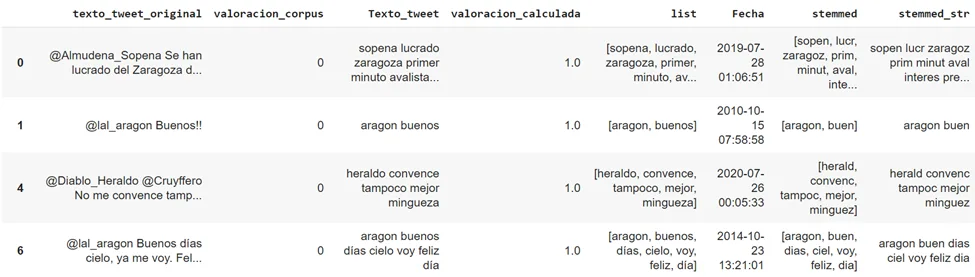
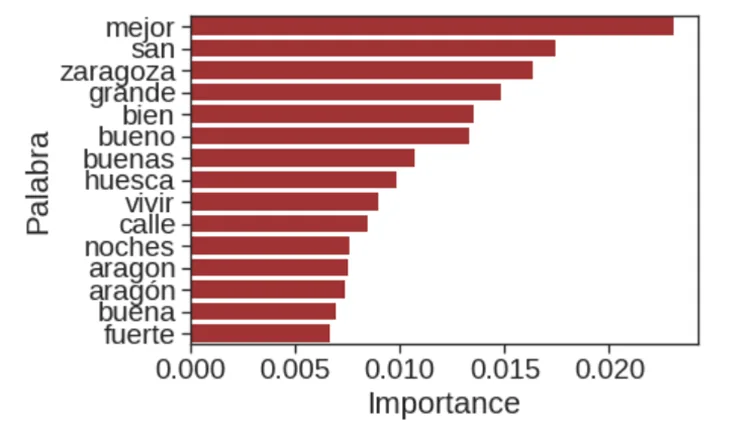
We now apply Machine Learning models and analyze results (taking the calculated valuation as a reference):
Random Forest Classifier
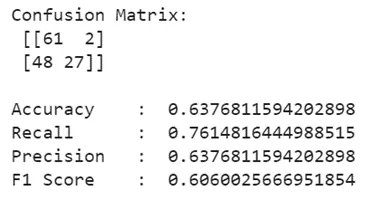
SVM
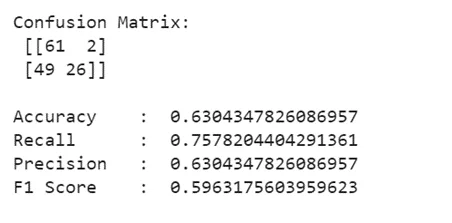
XGBoost
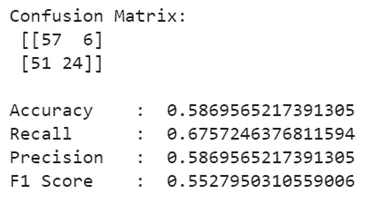
The RF model, again, is the most promising, so we again use GridSearchCV to see if we can improve the classification.
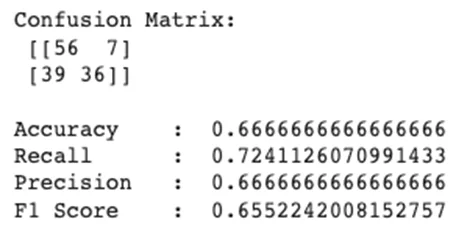
We did not see a clear improvement in this comparison. Assessing generalisation requires independent human labels.
Phase V. EVALUATION OF RESULTS
All the code and data used, in case you want to consult it in more detail, are available at https://github.com/FJDevelop/HaPyness-Saturdays-AI
A. Comparison of ML models
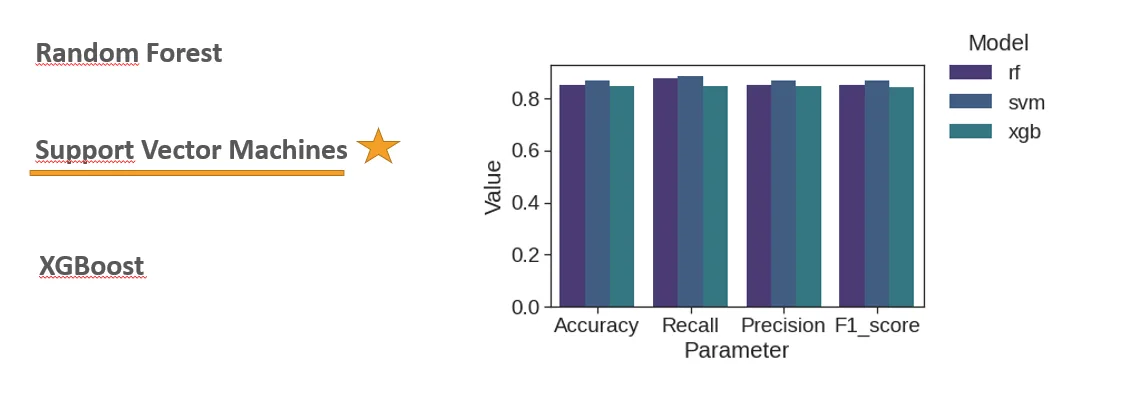
Among the different ML models using manually labeled classes directly, the SVM is the one that yields slightly better results.
B. Comparison of ML Models vs Valuation
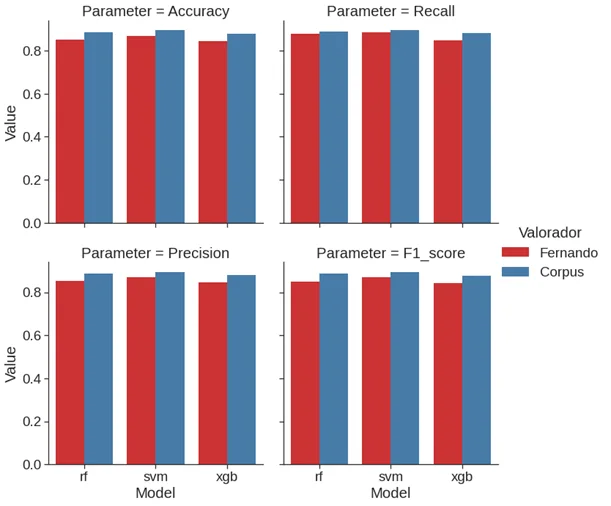
It can be seen that the valuation model has a performance close to traditional automatic ML models.
C. Evaluation on directly obtained tweets
Evaluation of the results of the models in relation to the evaluation of previously unlabeled tweets
Using the best pre-trained and saved models (model.pkl), some differences are observed:
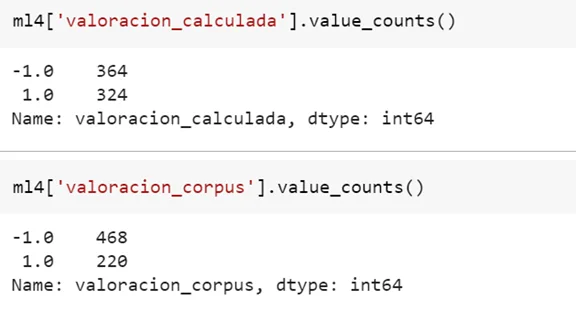
Therefore: comparing the models in different scenarios
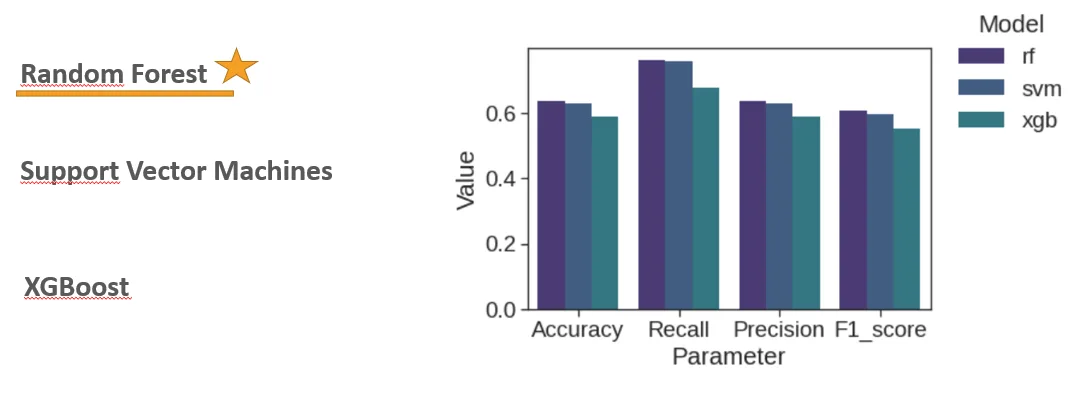
The image shows that automatic scoring on a new sample agrees less with the reference used. Sample heterogeneity and differences in cleaning may play a role; we have not isolated their effects.
D. Analysis of the variation of the perception of Happiness/Sadness
We transform the date field, and classify those tweets that belong to a pre-covid phase or that correspond to the covid stage
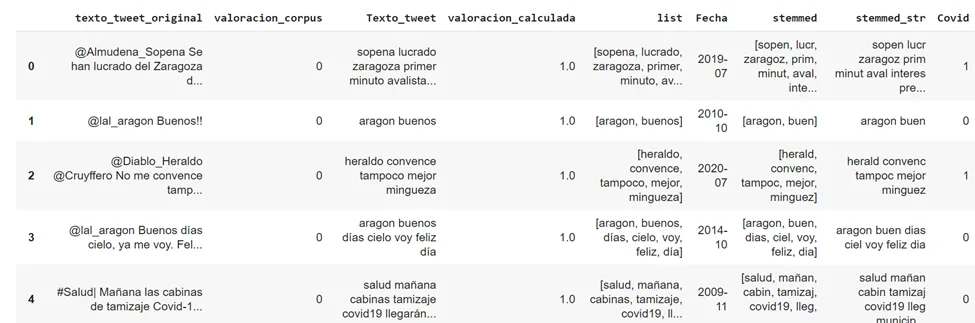
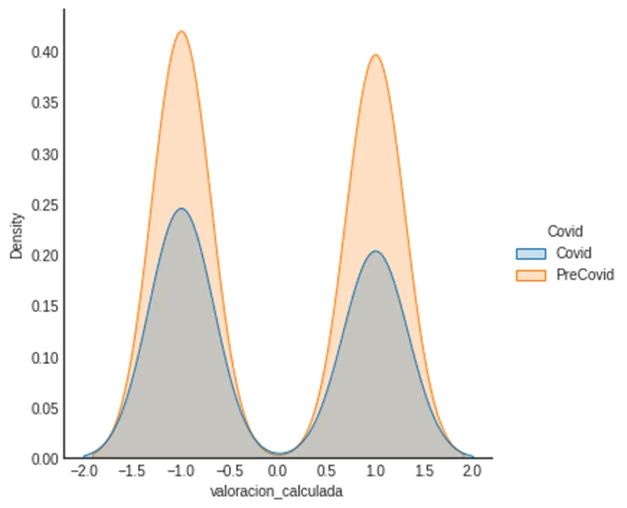
A greater imbalance is observed in the covid stage, with comments closer to sadness than in the precovid period, where despite sadness predominating, the results were much closer
Visualization of evolution
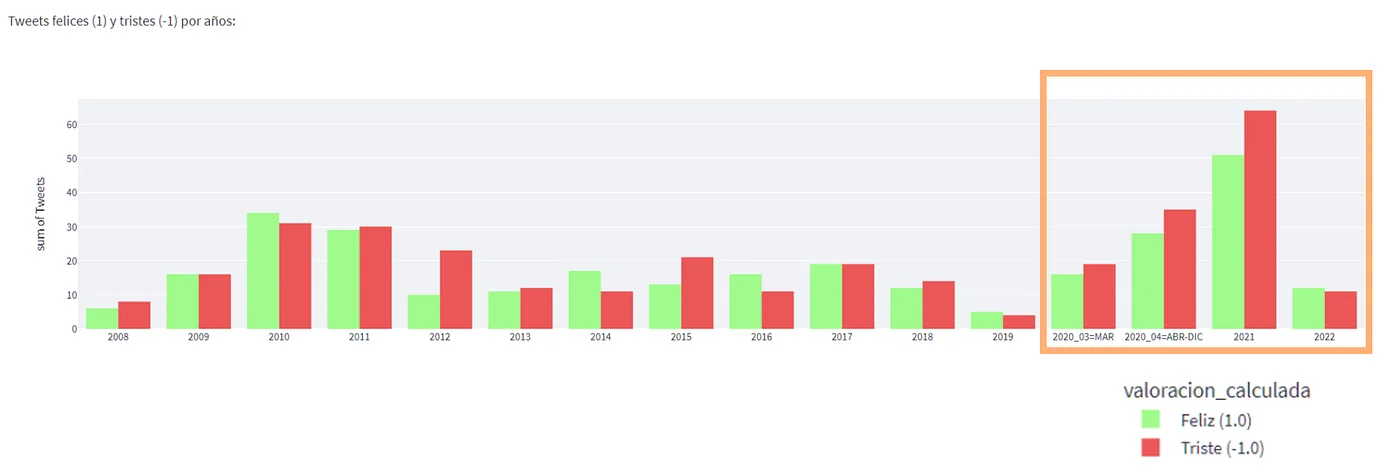
We see that using Machine Learning the result predicts more negative tweets, in general.
Phase VI. Deployment
To put the final models and the results obtained into production, we use Streamlit which is an open source Python library that makes it easy to create and share custom web applications for machine learning and data science.
Our application in streamlit is a Happiness evaluator which allows you to carry out the analysis of the text you enter, resulting in its evaluation, as well as the words that have determined that evaluation.
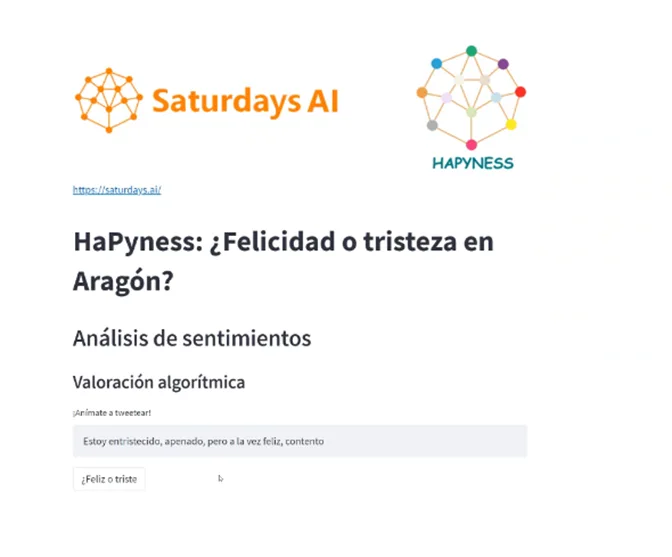
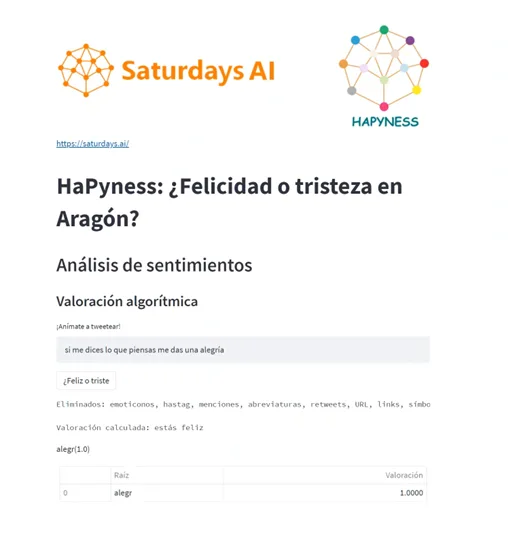
On the other hand, it allows the visualization of the evolution of feelings regarding Happiness/Sadness in the selected sample.
Conclusions

The conclusions obtained after the development and resolution of the general objective are:
With respect to the linked to our objectives:
We have managed to develop a tool of automatic labeling of texts, with 63% accuracy against the corpus and 53.2% agreement in the comparison between the ML model and automatic labels. These are modest results that require validation and human review, not measurements of people’s psychological state.
Additionally, we have developed a model that analyzes the evolution of feeling expressed in the sample of tweets associated with Aragón. It lets us explore changes in labels over time, but does not establish that the sample represents the whole population or that the pandemic caused those changes.
At a general level, the main conclusions that we have obtained are:
– The concept of Happiness and Sadness it is not common to all people both in the expression and in the evaluation, so this can affect the evaluation due to the difficulty of standardizing the expression of a feeling.
– The complexity of interpreting tweets is so great that it can have a great impact on both the subjectivity of the person and that of the moment of the evaluation. To solve this, a vote could be carried out among several people at the vocabulary level and at the tweet level.
– Risk of confusion between positivity-negativity and happiness-sadness when evaluating words.
– Source bias chosen Twitter (social networks more biased than others, 280-character message can limit the expression of emotion, accessible to all types of the population?).
– Bias in language, which is transferred to our dictionary. Weighting of happy and sad words (30 -70).
– Risk of loss of information in pretreatment: removing emoticons, hashtags (#) and other elements may have discarded information relevant to the final score.
– Importance of context in analysis and assessment.
– The results of the three models that we have used have been very similar, although the Random Forest model was promising in some comparisons, while SVM performed slightly better in another. There is no universal winner in these experiments. We could explore further SVM and XGBoost hyperparameters or test neural networks.
– In this 2022 project, we struggled to find NLP resources suited to spanish, and our context.
Improvements and Evolution
As possible proposals for the evolution of the tool

ML Analysis Features:
- Explore and further analyze Kmeans results
- Explore and analyze the options provided by Word Embeddings
- Improve results of models with hyper parameters
- Using NLP techniques, perform semantic searches (cluster grouping, topics, profile similarity, trend prediction)
- Explore neural networks
Sources:
- Extend the analysis to a higher volume of tweets
- Apply our model to other types of sources (social networks, press,…)
- Analysis of the accounts that generate the tweets
Emotion analysis:
- Expand the dictionary to more categories of emotions
- Incorporate emoticon analysis, hashtag in the evaluation
- Account for sarcasm and negation.
- Incorporate context analysis (of the tweet itself and the context of the tweet itself)
- Incorporate emotional analysis
- Explore person-level analysis only with consent and a specific assessment of privacy and validity; do not infer diagnoses from tweets.
Display:
- Incorporate geolocation maps of tweets for analysis of ratings by area.
- Customized emotion analysis radial chart
Alerts and recommendations:
- Alert system based on emotional state.
- Specific thematic recommendations adapted to this personalized analysis.
- Generic recommendations accessible to all profiles
- Ideas for alerts about depression or suicide risk remained outside the project’s validated scope. These labels should not be used for such alerts without clinical research, professional oversight and privacy safeguards.
Acknowledgments
To the entire Saturdays AI team, and above all to the team of Saturdays AI Zaragoza, especially to Rosa Montañés, Mª del Carmen Rodríguez, Rocío Aznar and Rafael del Hoyo since without them it would not have been possible.
We had a very positive experience, with a very effective learning methodology based on practice.Thank you for all your support, patience and dedication!
Y to you, for having come this far in reading the article.
References:
Github
All the code and data used are available in https://github.com/FJDevelop/HaPyness-Saturdays-AI/tree/main
Vocabulary related to happiness and sadness http://www.ideasafines.com.ar/buscador-ideas-relacionadas.php
Datasets
Tass Corpus:
Personalized access to the TASS Corpus
http://tass.sepln.org/tass_data/download.php
https://gplsi.dlsi.ua.es/sepln15/es/taller-de-analisis-de-sentimientos-en-la-sepln-tass
Sentiment analysis
NRC Word-Emotion Association Lexicon (aka EmoLex)
https://saifmohammad.com/WebPages/NRC-Emotion-Lexicon.htm
Sentiment Analysis in Python
https://neptune.ai/blog/sentiment-analysis-python-textblob-vs-vader-vs-flair
Developments
Example of sentiment analysis in Spanish
https://pybonacci.org/2015/11/24/como-hacer-analisis-de-sentimiento-en-espanol-2/
Tweet analysis
https://www.cienciadedatos.net/documentos/py25-text-mining-python.html
Information of interest
Tool to carry out the Demo.
Streamlit: https://docs.streamlit.io/library/get-started/create-an-app
Covid information
Mental health data on coronavirus impact
https://consaludmental.org/sala-prensa/manifiesto-salud-mental-covid-19/
Survey statistical data
Members
- Fernando Jiménez
- Héctor Soria
- Virginia Navarro
Project presentation: Demoday
Repository
The code for this project can be found at GitHub
More artificial intelligence!
Saturdays.AI makes AI more accessible through shared learning and projects with a social purpose. Our motto is AI4ALL IS AI4GOOD.
A story from the Saturdays.AI community. Originally published on Apr 7, 2022.
← More community stories