Detection of land under renovation with Artificial Intelligence
La Paz. 2021 In this article, we will see how to carry out land detection with Artificial Intelligence in order to identify the land (lots) available for production (under renovation). In this way…
A learning project shared by the community. The article documents its team, methods and results; it does not establish that the prototype is ready for real-world use.
La Paz. 2021
In this article, we will see how to carry out land detection with Artificial Intelligence in order to identify the land (lots) available for production (under renovation). In this way we intend to improve the costs and efficiency associated with its detection and exploitation.
We understand by land subdivision the process of dividing the land, regardless of the number of resulting properties, whose project contemplates the opening of new public roads, and their corresponding urbanization. However, we will analyze the land for its agricultural production.
The data are extracted from the geographic database of production monitoring of sugarcane growers in the northern area of Santa Cruz. All this is managed in a CADASTRE.
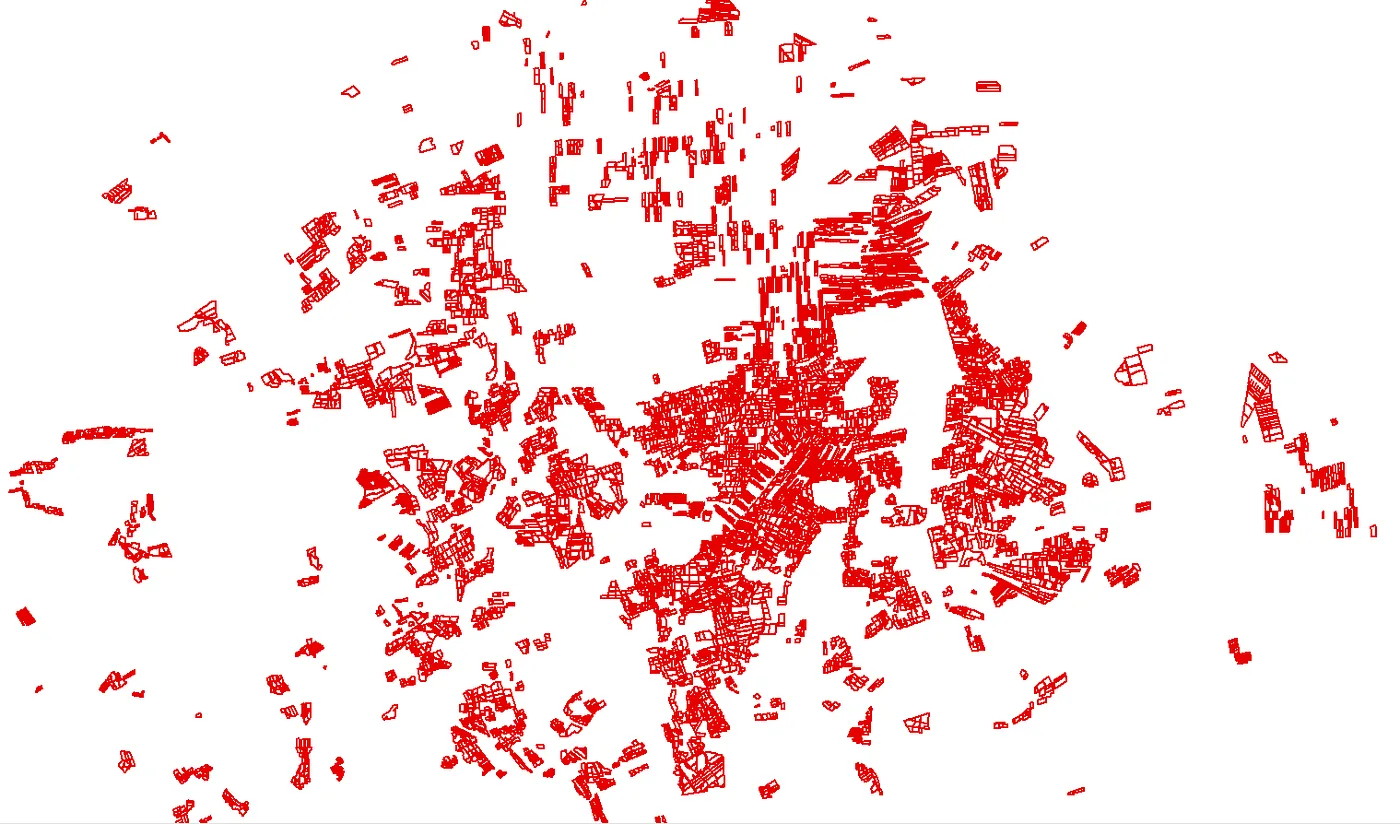
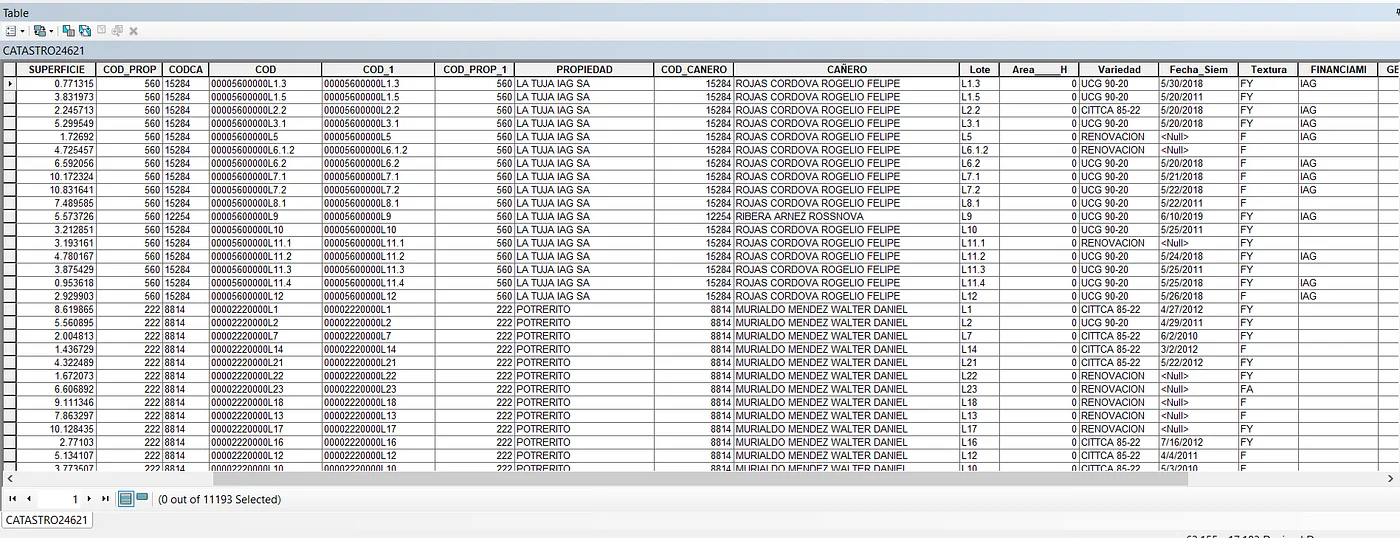
This geographic information is linked to tabular data:
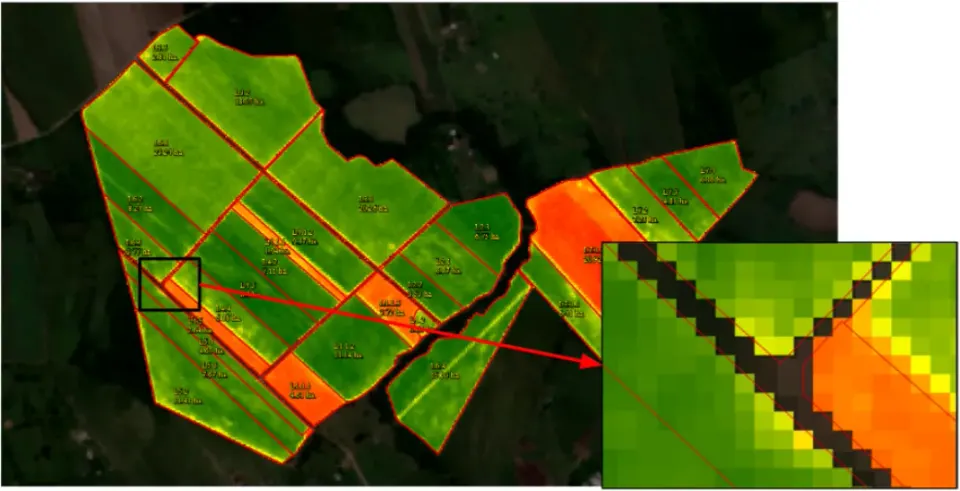
Then you can have a visualization of the status of the lots, whether they are in production (with coverage) or under renewal (without coverage) through the polygons that limit the lots and the satellite images.
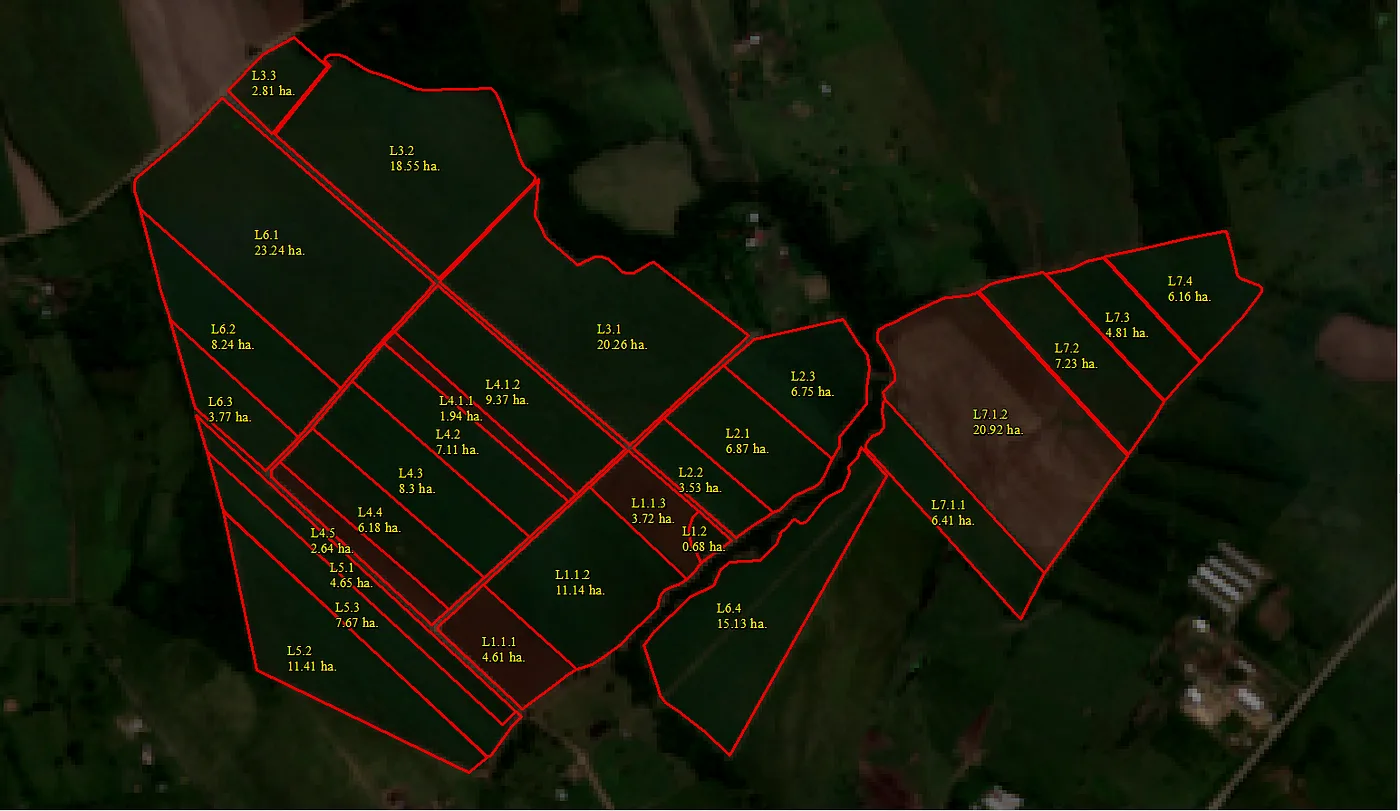
It is these images at different times of the year that allow us to visually analyze whether the lots are being renovated or not.
Problem description:
Determining whether or not a lot is under renovation is important since it is a variable when calculating the production and performance of the properties of each sugarcane grower, and for this the following drawbacks arise:
- Field inspections and manual satellite-image review are time-consuming.
- Susceptible to errors.
- Too much time invested.
Objective:
Determine if a sugarcane crop plot is under renewal through the change in coverage based on NDVI statistical data from the last 12 months with Machine Learning.
Solution proposal.
Satellite images can be processed to obtain certain indices. The index of interest to observe if a lot is under renovation is called NDVI (Normalized Difference Vegetation Index):
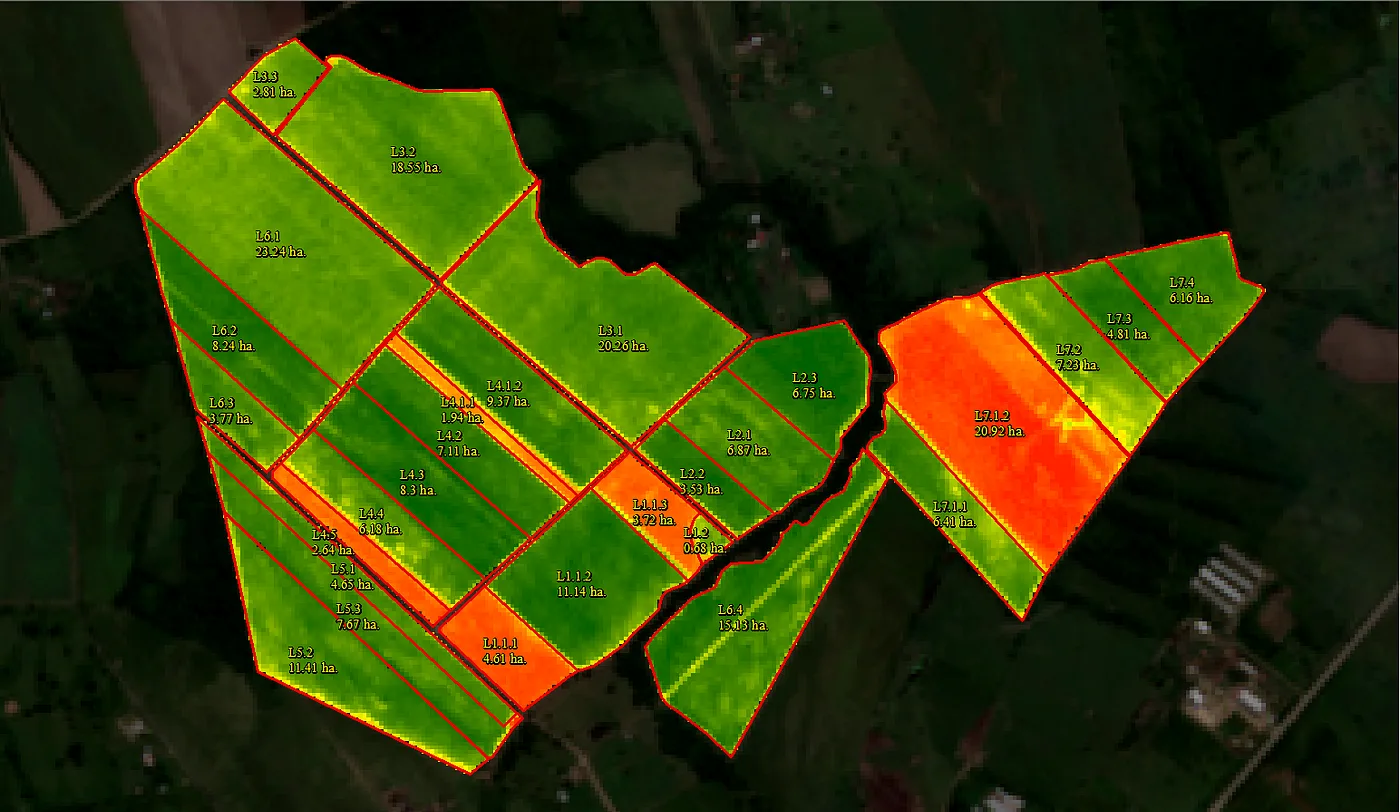
You can see the lots with coverage in green, and those without coverage in red, this color thing is just symbology. What you really have with NDVI is a matrix of pixels:
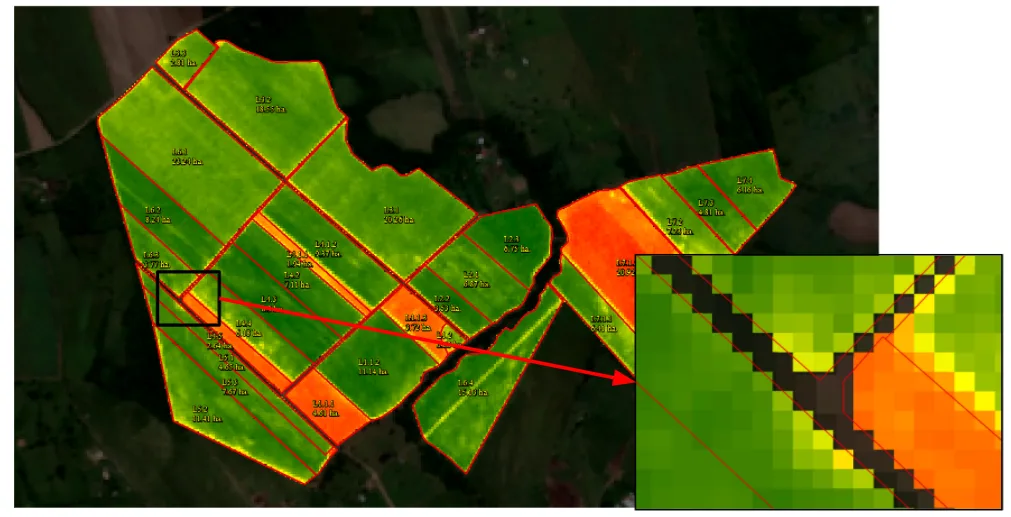
Each pixel has an NDVI value between -1 and 1. Values close to zero generally indicate little or no vegetation, while high positive values are associated with denser vegetation. A value of -1 should not be treated as the general value for bare soil.
Then, the descriptive statistics of each lot can be obtained, and through its mean and standard deviation determine whether a lot is under renovation or not.
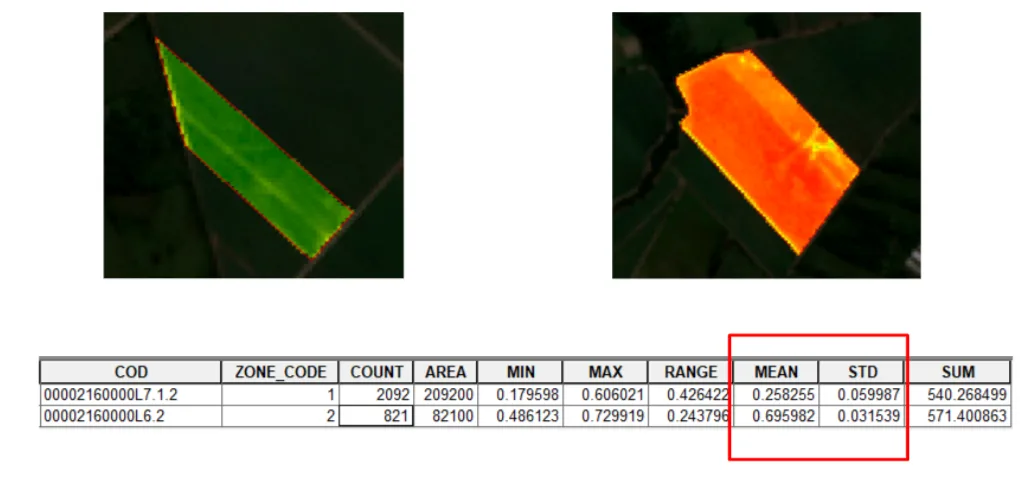
In this example, plots with vegetation cover have a mean closer to 1, while plots without cover are closer to 0. A low standard deviation indicates that pixel values within a plot are relatively uniform.
Feature engineering.
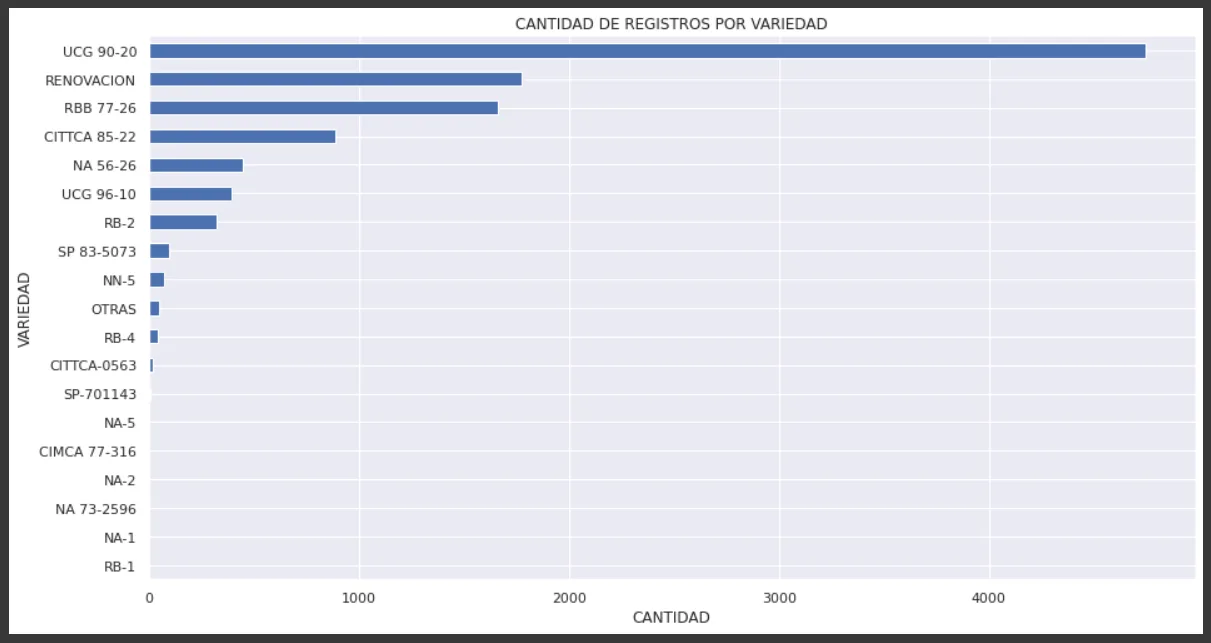
- We used the Variedad field to construct the target variable: it contains the planted variety or the label “Renovación” when a plot is undergoing renewal. We named the new column Renovación.
- We convert the Renewal field from categorical to boolean.
- We combined the 13 datasets (one cadastral dataset and 12 containing monthly statistics for the previous year) into a single dataset for analysis.
Data Visualization
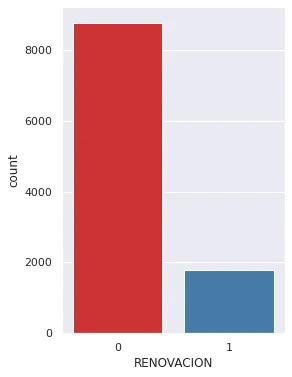
- Number of registrations per Renewal.
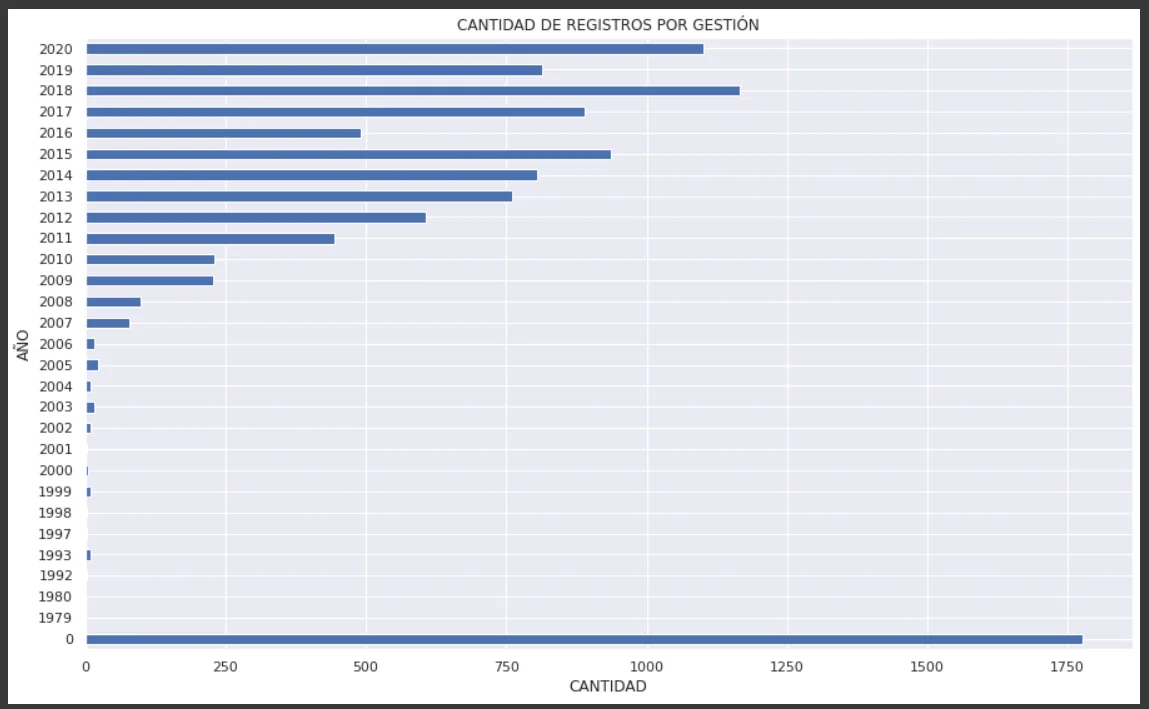
- Number of records per growing season.
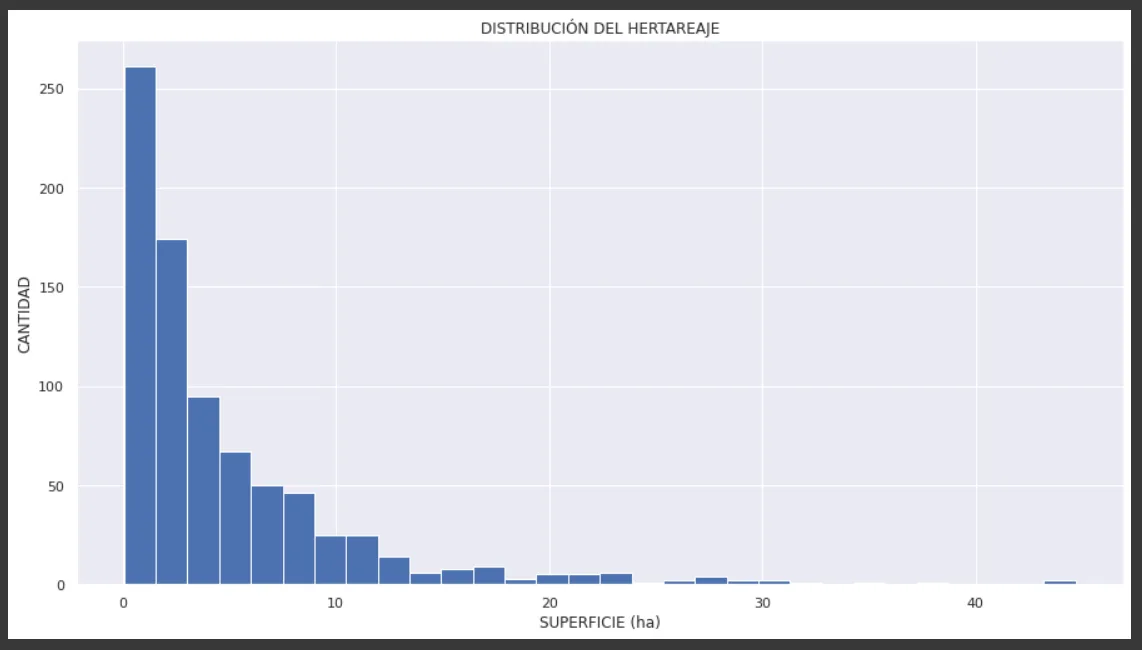
- Number of records per hectare.
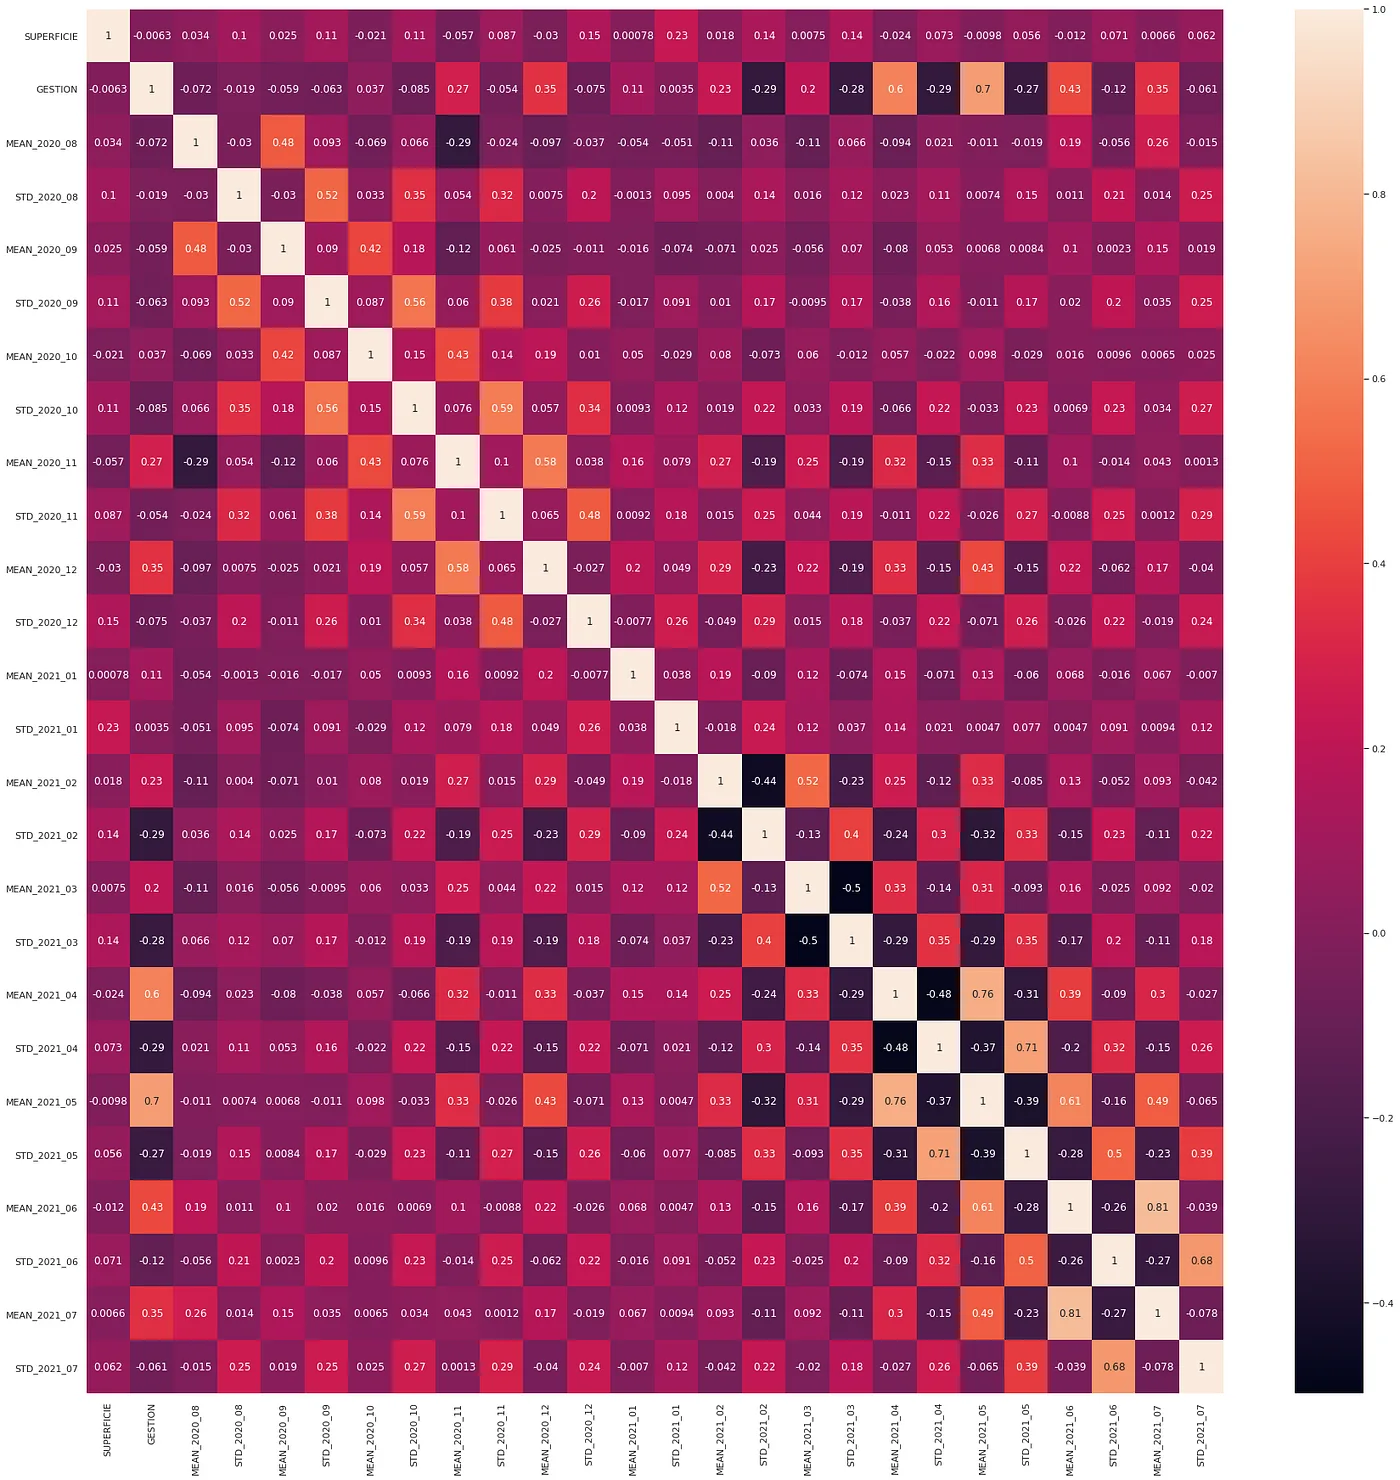
- Correlation matrix.
- Visualization of the target balance.
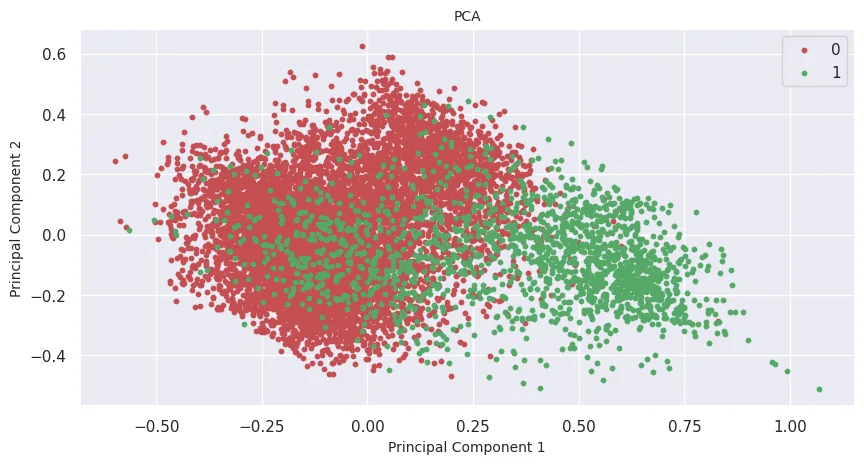
Dimension reduction through PCA.
Dimension reduction was carried out through PCA to two main components, and a difference can be seen between the records:
Model training
Three types of models were tested, Cross Validation was also implemented. The results were the following:
- Logistic Regression
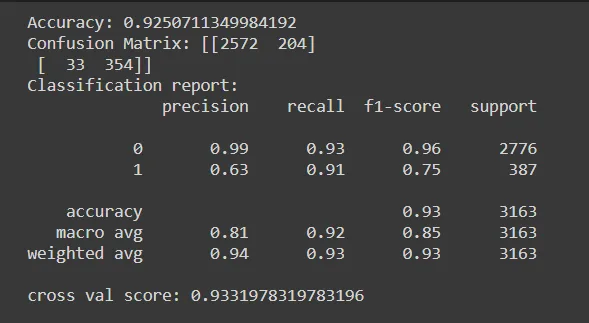
- Random Forest
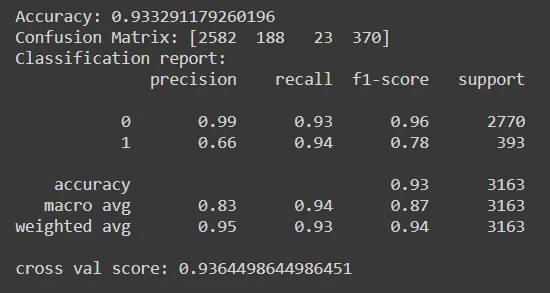
- SVM
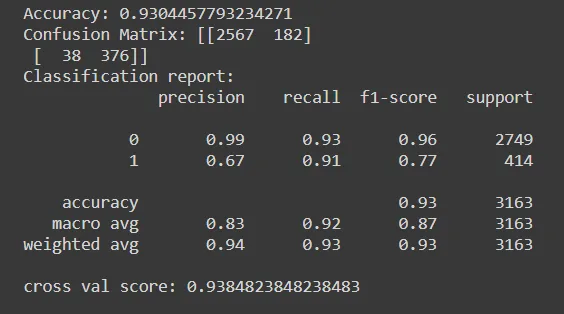
Choosing the best model
Based on the results obtained, we will now choose the most appropriate Artificial Intelligence model for the detection of land under renovation:
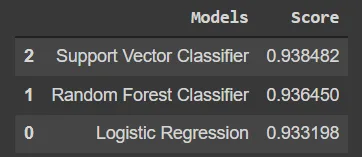
It is observed that the 3 selected models approach the same probability 0.93, however, SVM has a better score.
We also examined the ROC curve and obtained the following result:
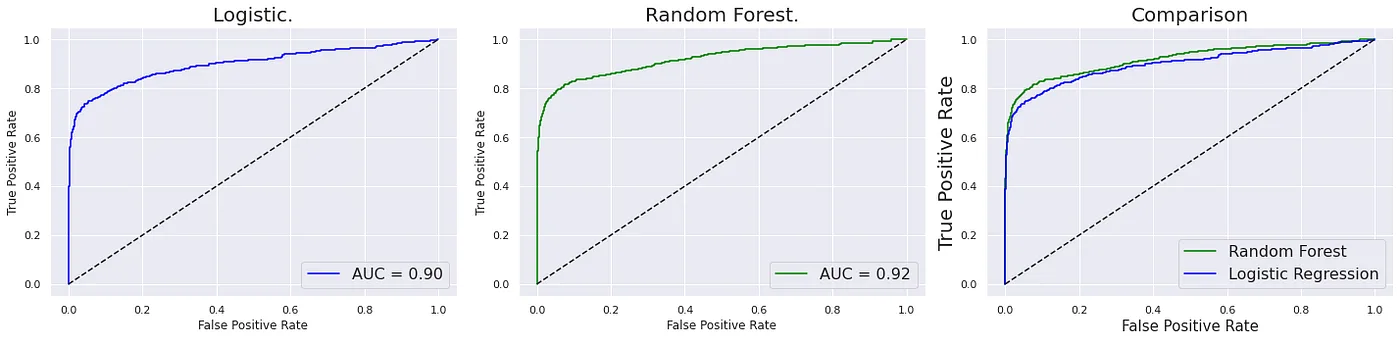
In this case, Random Forest is the one that has the greatest area under the curve, therefore, SVM and Random Forest are the best models to consider for the classification of lots under renovation.
Authors of the project.
- Bismark Socompi.
- Ruth Paola Vedia
- Cristian Vargas
Written by
Bismark Socompi Rodriguez

More artificial intelligence!
Saturdays.AI makes AI more accessible through shared learning and projects with a social purpose. Our motto is AI4ALL IS AI4GOOD.
A story from the Saturdays.AI community. Originally published on Nov 18, 2021.
← More community stories