Credit Card Fraud Detection with Machine Learning
We compare algorithms for credit card fraud detection using simulated data, from feature engineering to ROC AUC evaluation.
A learning project shared by the community. The article documents its team, methods and results; it does not establish that the prototype is ready for real-world use.

This article explores credit card fraud detection using machine learning algorithms.
Cyber fraud uses online systems to carry out unlawful transactions (Condusef, n.d.). Credit card fraud is a familiar risk in online shopping: stolen card details can be used to make unauthorised purchases or withdraw funds from a victim’s account (Cornell Law School, n.d.). It is one form of identity theft.
In this scenario, fraud detection with Machine Learning for credit card transactions is of utmost importance. Currently, large amounts of money are lost due to this type of fraud, which represents a great problem for financial institutions and their users.
Companies often respond by replacing cards, investigating cases and providing telephone support, all of which cost money. Even with this support, fraud can damage their reputation and lead to lost customers and revenue.
How to avoid or minimize the costs of fraudulent transactions?
Artificial intelligence provides machine learning algorithms capable of identifying patterns in transactions and detecting whether a certain transaction is fraudulent or not.
Project Description
The general objective of the project is to develop a fraud detection method using Machine Learning algorithms capable of effectively classifying between legitimate and fraudulent transactions.
Image from IEEE Innovation at Work
Data collection
Because we did not have real transactions that could be shared while respecting confidentiality, we used a simulator to generate legitimate and fraudulent transactions.
The essential characteristics that summarize a transaction are: transaction ID, transaction date and time, customer ID, terminal ID, transaction amount, and a label that shows whether the transaction is fraudulent or not.
The simulation consists of five steps:
1. Customer Profiling: Every customer is different in their spending habits. This will be simulated by defining some properties for the customer such as their geographic location, their spending frequency, and their spending amounts.
2. Terminal Profiling: Here, the only property that will be taken into account is the geographical location.
3. Association of customer profiles and terminals: it is assumed that customers only transact on terminals that are within a radius r, of their geographical locations.
4. Transaction generation: the simulator will go through the set of customer profiles and generate transactions based on their properties.
5. Generation of fraud scenarios: transactions are labeled as legitimate or fraudulent, using the following fraud scenarios.
a. Scenario 1: Any transaction whose amount is greater than 220 is labeled as fraudulent. (Scenario not inspired by reality, the value is chosen according to the distribution that the amounts variable follows).
b. Scenario 2: two terminals are randomly selected each day. All their transactions over the next 28 days are labelled fraudulent, simulating compromised terminals.
c. Scenario 3: three customers are randomly selected each day. Over the next 14 days, one third of their transactions have their amounts multiplied by five and are labelled fraudulent, simulating card-not-present fraud.
Thus, we have the following set of data:
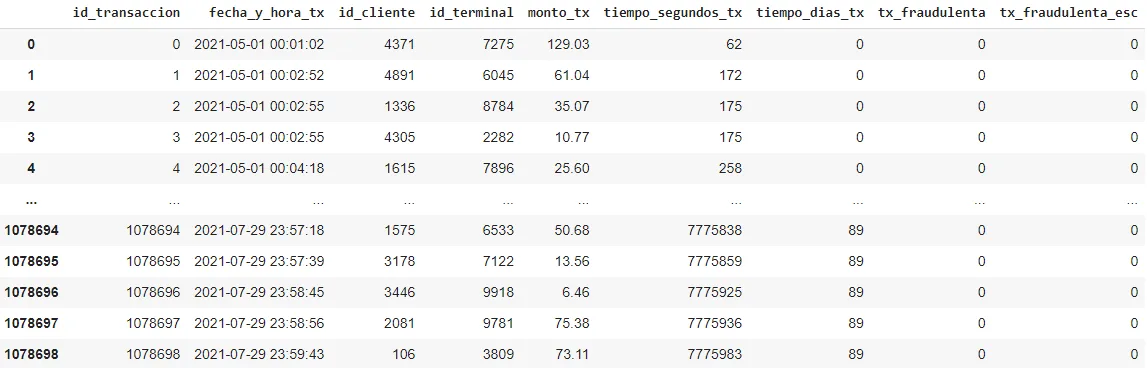
The simulator generated 1,078,699 transactions, of which 8,590 (about 0.796%) were labelled fraudulent. That corresponds to around 12,000 transactions per day over the simulated period.
The dataset presents an imbalance, less than 1% of transactions are fraudulent.
The transaction amounts have a mean of 53.69, with a standard deviation of 42.13 and a maximum amount of 1 248.85.
The first transaction was recorded on 1 May 2021 at 00:01:02 and the last on 29 July 2021 at 23:59:43.
Data preparation
The algorithms used require a numerical representation of the features. That does not mean every field has a meaningful order: identifiers, for example, are labels.
The transaction amount is numerical, while the fraud label is the target we want to predict. Timestamps and customer and terminal identifiers can be used to derive features; the target label is not a model input.
The first transformation consists of generating two new binary features, from the date and time, that characterize potentially relevant periods.
1. If a transaction occurs during a business day (0) or weekend (1).
2. Whether the transaction occurs during the day or at night; we define night as 00:00–06:00.
For each customer, we calculate transaction counts and average amounts over windows of 1, 7 and 30 days, producing six additional features.
For each terminal, we also calculate transaction counts over each time window and a risk score based on previous fraudulent transactions. When evaluating this approach, only information available at the time of a transaction should be used, to avoid leakage from future data.
Model training
Once the dataset is ready, the dataset is partitioned into training data (60%) for development and test data (40%) for model validation.
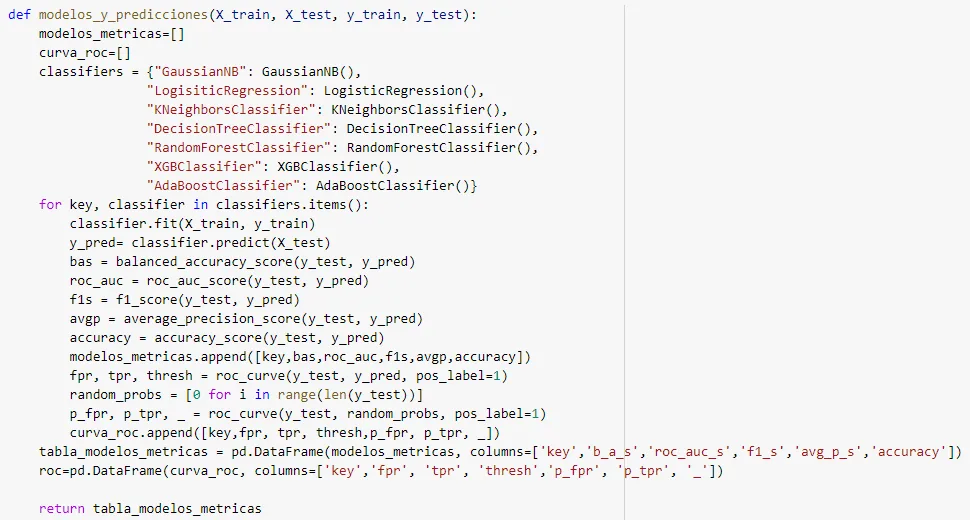
For this binary classification task, we tested Naive Bayes, logistic regression, KNN, decision trees, Random Forest, XGBoost and AdaBoost.
Model evaluation and validation
After training the algorithms, the results are evaluated with different metrics and the following information is obtained:
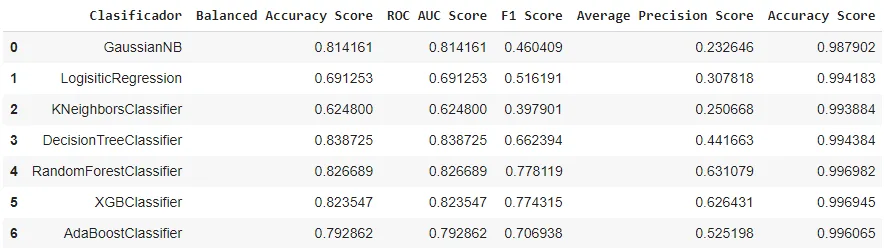
We used ROC AUC to compare how well the models discriminated between classes. The decision tree scored about 0.83. This is not the same as 83% accuracy, and the metric does not itself prevent overfitting.
An ROC curve plots the true positive rate against the false positive rate at different thresholds. The area under it, AUC, summarises discrimination. The following chart compares the algorithms:
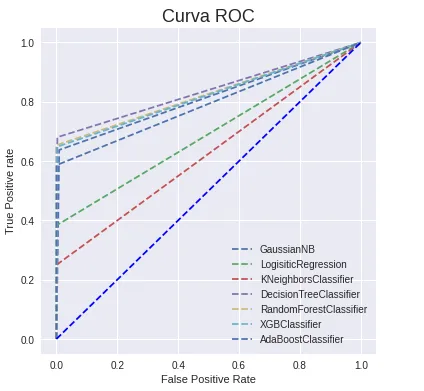
The decision tree achieved an ROC AUC of 0.836. Given the strong class imbalance, this should be considered alongside precision, recall and the cost of errors.
The results of the model can be expressed using a confusion matrix:
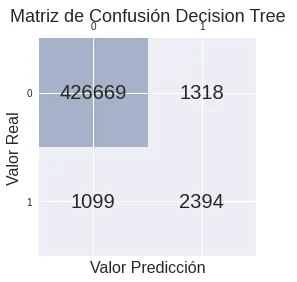
It can be seen that the model has identified:
- 426,669 cases of true negatives, for transactions NOT fraudulent and that the model predicted as NOT fraudulent.
- 2,394 cases of true positives, for fraudulent transactions and that the model predicted as fraudulent.
- 1,099 cases of false negatives, for fraudulent transactions and that the model predicted as NOT fraudulent.
- 1,318 cases of false positives, for transactions that were NOT fraudulent and that the model predicted as fraudulent.
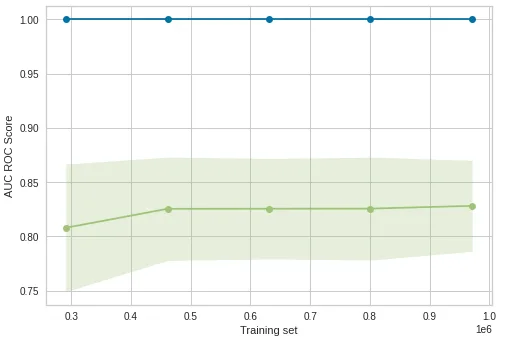
A learning curve shows the relationship between the training score and the cross-validated test score for an estimator with a varying number of training samples.
The curve shows a training score near 1.00 and an evaluation ROC AUC around 0.83. The gap calls for closer examination of overfitting.
Conclusions
- Among the models tested in this project, the decision tree achieved the best ROC AUC, around 0.83.
- Due to the amount of transaction data, in the training phase it is essential to have computational power to experiment with different algorithms and evaluate their results in a reasonable time.
- The method is a prototype evaluated on simulated data. Use in a financial institution would require validation on representative real data, additional fraud scenarios, and assessment of false positives, false negatives and changing transaction patterns.
References
Barrios, J. (2019). The confusion matrix and its metrics. Available at: https://bit.ly/3C3ibLE
Condusef (s.f). Types of fraud. Available at: https://bit.ly/3kbcmpz
Cornell Law School (n.d.). Credit Card Fraud. Available at: https://bit.ly/3lgOCQ2
Gebejes, A. & Khokhlova, A. (2021). Learning Curve Theory. Data of Learning. VALAMIS. Available at: https://bit.ly/3lhipbp
Le Borgne, Y. & Bontempi, G. (2021). Machine Learning for Credit Card Fraud Detection — Practical Handbook. Université Libre de Bruxelles. Available at: https://bit.ly/3k7tbBH
McKinney, T. (s.f). Fraud Detection in Python. Available at: https://bit.ly/3lb40xi
Written by
Martin Mercado

More Artificial Intelligence!
Saturdays.AI makes AI more accessible through shared learning and projects with a social purpose. Our motto is AI4ALL IS AI4GOOD.
A story from the Saturdays.AI community. Originally published on Nov 19, 2021.
← More community stories