HUMANDS: using AI to explore employee attrition
HUMANDS explores employee-attrition prediction with machine learning and examines how estimates change when input data is modified.
A learning project shared by the community. The article documents its team, methods and results; it does not establish that the prototype is ready for real-world use.
Donostia. 2021
Artificial Intelligence for employees
Bilbao 2021. Pablo Martín García (Pablo) and Omar Calderón (Omar Calderon). Artificial intelligence techniques applied to employees cover a growing need given how expensive it is in time and money to find good collaborators for companies, in addition to the training they have to give them for their good performance within the organization. Therefore, retaining these talents has become a great challenge and at the same time a necessity, which is not easy to face, people today no longer tend to stay where they are not comfortable and do not feel valued.
High employee turnover has become normal in many companies. As an example, in the technology and tourism sectors, 75% of their employees, despite having a permanent position, are actively searching for new offers. Which represents a big problem in terms of costs, work environment and efficiency. When you have a work environment like this, other employees tend to do the same, since this gives a feeling of instability and causes delays in work.
Currently, one of the most serious problems that companies face is the talent drain. And, although this migration of human talent affects all companies and all sectors, today, in our country, the sectors that are most affected by this are technology and tourism. According to several surveys carried out throughout 2020, more than 75% of employees in these sectors affirm that, despite having a job, they continue to actively search for other job offers, a problem that we will try to address with artificial intelligence techniques.(https://interimgrouphr.com/blog/gestion-talento/fuga-talento-causas-soluciones/)
Currently in Spain, 9 out of 10 employees do not feel comfortable in their current job and this means that organizations have to rethink strategies to improve the conditions of their collaborators, but the criteria to improve them should not be chosen by intuition, as has been done all their lives, which has led to these current results.
One of the reasons why organizations lose their employees is job dissatisfaction. Unfortunately and according to the data it handles Bizneo HR, almost 9 out of 10 Spaniards are unhappy in their jobs. And what are the reasons for this discontent? Among others, the impossibility of prospering in the company and the difficulty of reconciling work and family life. Mainly.(https://www.bizneo.com/blog/como-evitar-la-fuga-de-talentos-en-tu-empresa/)
Objectives:
- Estimate the probability of employee attrition from the project’s data using artificial intelligence.
- Explore information that could inform improvements to working conditions and further questions about employee retention.
Data:
IBM HR Analytics Employee Attrition & Performance
We used IBM HR Analytics Employee Attrition & Performance, a dataset of 1,470 profiles with variables such as age, pay and job satisfaction. It provides a resource for modelling experiments; this analysis does not establish findings about IBM’s actual workforce.
Data exploration:
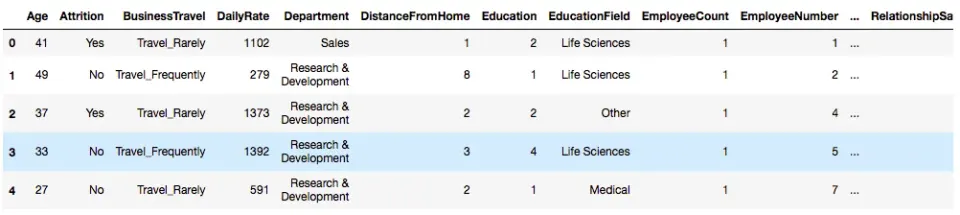
Look at the first rows:
Columns description:
AGE: Numeric value
ATTRITION: employee departure from the company (0=no, 1=yes). It does not measure emotional burnout.
BUSINESS TRAVEL: (1=Does not travel, 2=Travels frequently, 3=Travels occasionally)
DAILY RATE: Numerical value — Salary level
DEPARTMENT: (1=HR, 2=R&D, 3=Sales)
DISTANCE FROM HOME: Numerical value — Distance from home
EDUCATION: Numeric value
EDUCATION FIELD: (1=HR, 2=Science, 3=Marketing, 4=Medical Sciences, 5=Other, 6=Technical)
EMPLOYEE COUNT: Numeric value
EMPLOYEE NUMBER: Numeric value — Employee ID
ENVIROMENT SATISFACTION: Numerical value — Satisfaction with the environment
GENDER: (1=Female, 2=Male)
HOURLY RATE: Numerical value — Hourly wage
JOB INVOLVEMENT: Numerical value — Work involvement
JOB LEVEL: Numerical value — Working level
JOB ROLE: (1=Reception, 2=HR, 3=Technical LAB, 4=Manager, 5=Management Director, 6=Research Director, 7=Research Scientist, 8=Sales Executive, 9=Sales Representative)
JOB SATISFACTION: Numerical value — Job Satisfaction
MARITAL STATUS: (1=Divorced, 2=Married, 3=Single)
MONTHLY INCOME: Numerical value — Monthly Salary
MONTHY RATE: Numerical value — Monthly Ratio
NUMCOMPANIES WORKED: Numerical value — Number of Companies Worked
OVER 18: (1=Yes, 2=No)
OVERTIME: (1=No, 2=Yes)
PERCENT SALARY HIKE: Numerical value — Percentage of Salary Increase
PERFORMANCE RATING: Numerical value — Performance Ratio
RELATIONS SATISFACTION: Numerical value — Relationship Satisfaction
STANDARD HOURS: Numeric value — Standard Hours
STOCK OPTIONS LEVEL: Numerical value — Share Options
TOTAL WORKING YEARS: Numerical value — Total Years Worked
TRAINING TIMES LAST YEAR: Numerical value — Training Hours
WORK LIFE BALANCE: Numerical value — Work Life Balance — Personal
YEARS AT COMPANY: Numerical value — Total Years in the Company
YEARS IN CURRENT ROLE: Numerical value — Years in Current Position
YEARS SINCE LAST PROMOTION: Numerical value — Last Promotion
YEARS WITH CURRENT MANAGER: Numerical value — Years with Current Manager
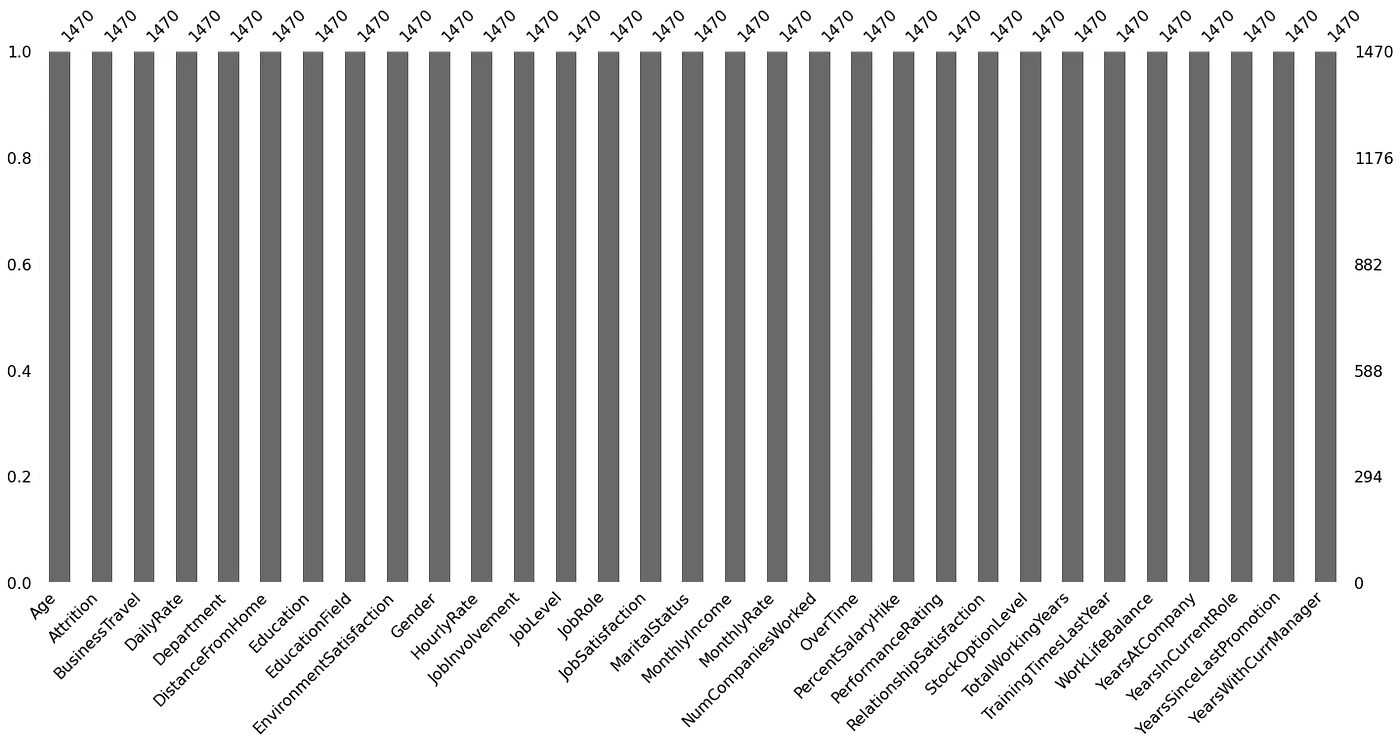
There are no null values in the dataset:
Correlation matrix:
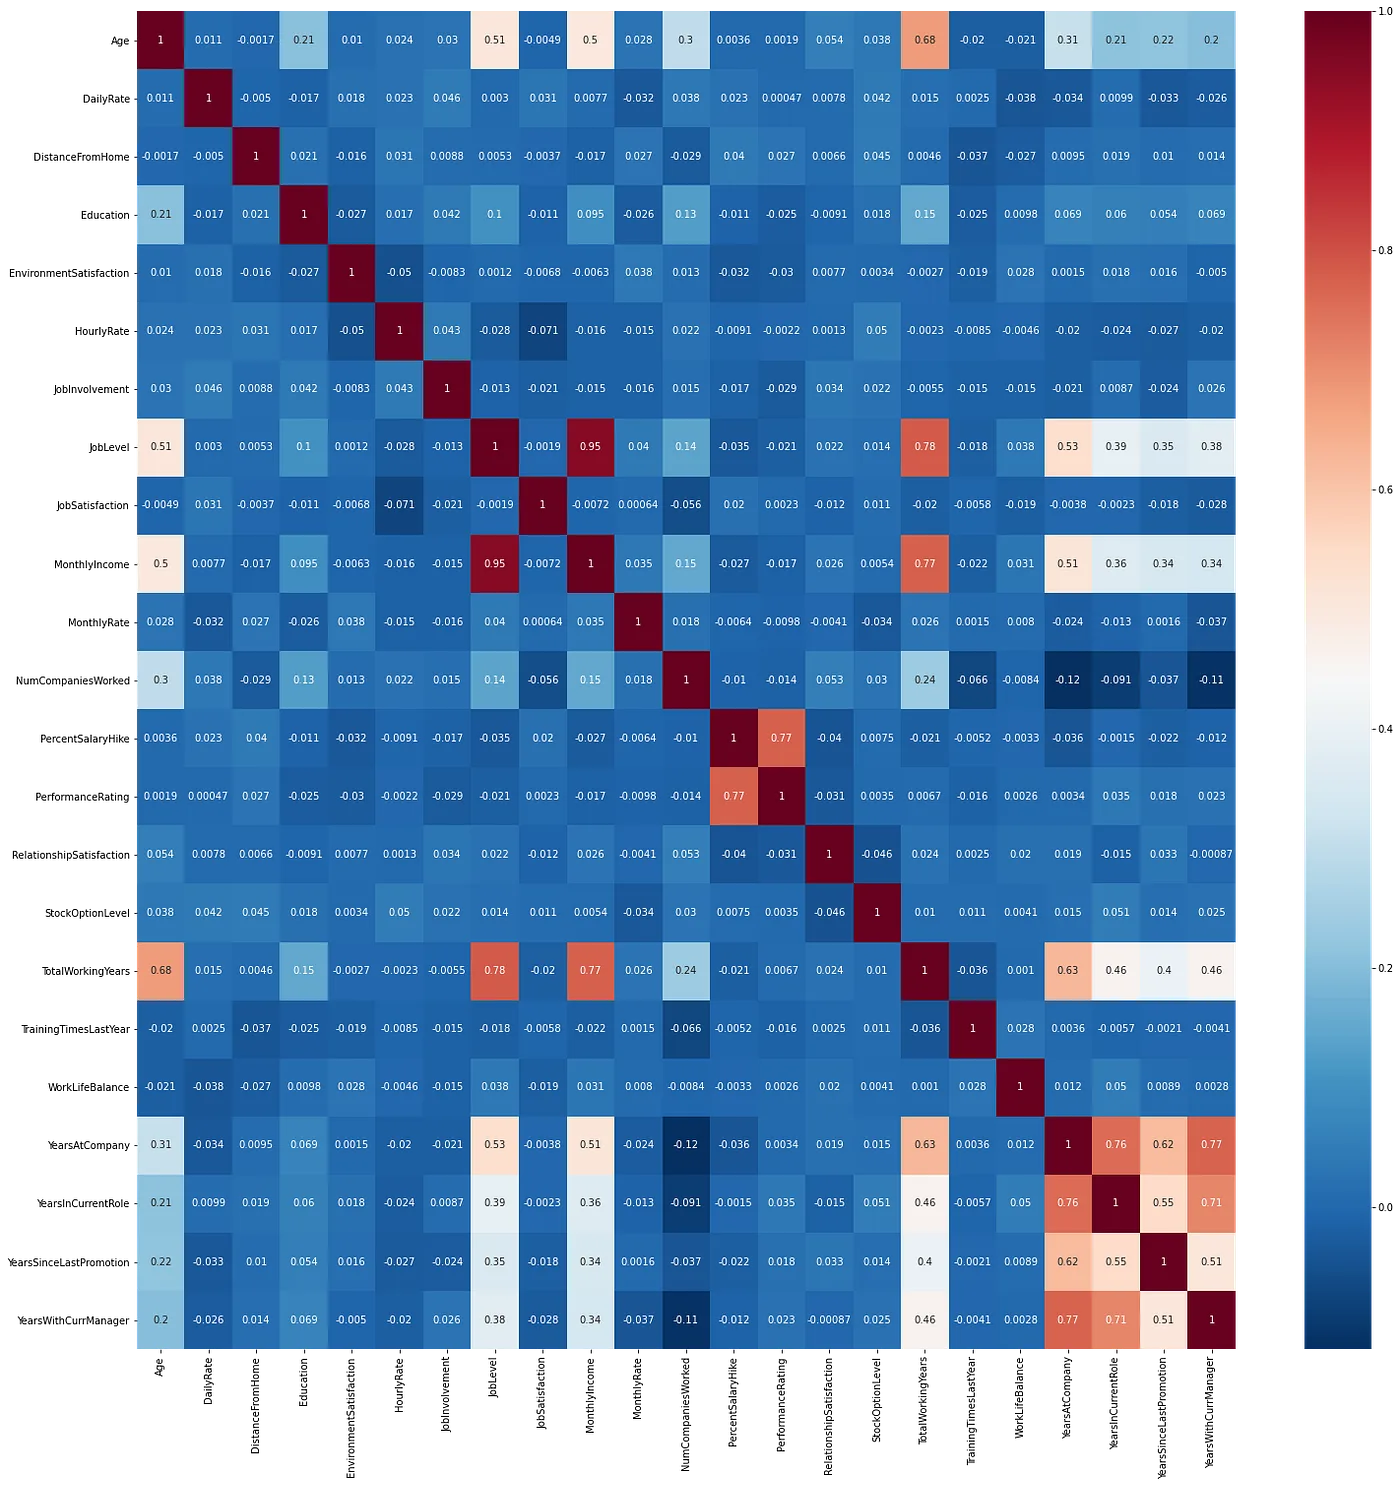
Correlation matrix
As we can see, within the matrix, the variables that have the most correlations with each other are the variables related to time, such as the number of years of experience, age, etc. Among themselves and with variables such as salary and job level.
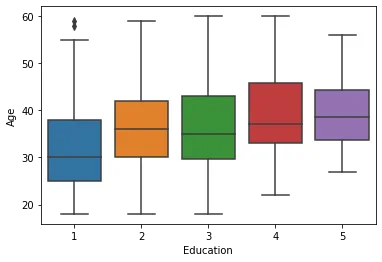
Education level and age
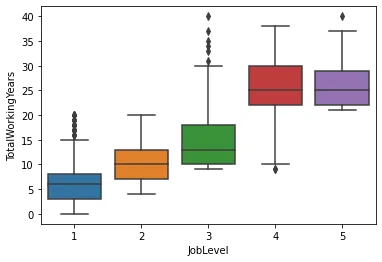
Years of experience and level of work
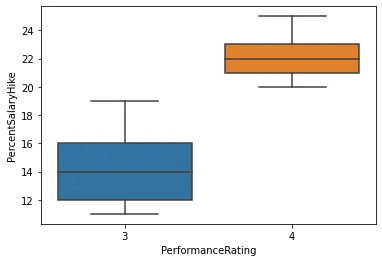
Performance ratio and salary increase
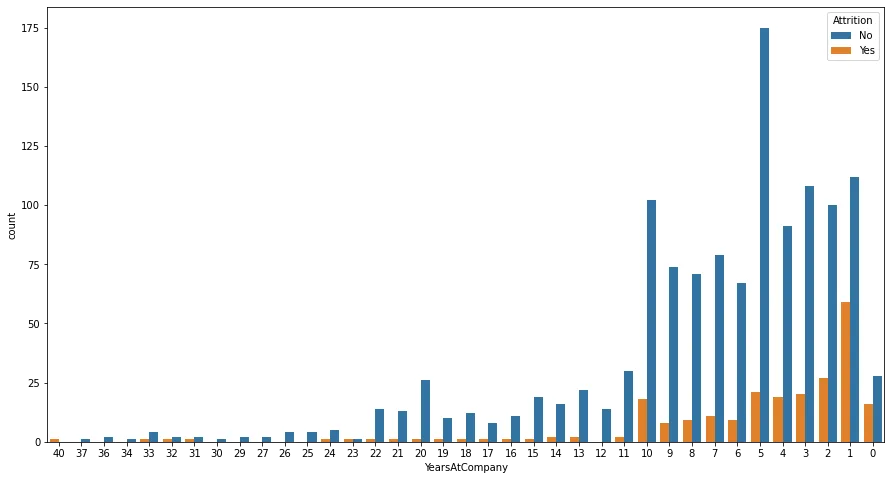
The following chart shows employee departures by tenure, from those with 40 years at the company to recent joiners.
Features engineering:
We are going to work deeply with our dependent variable, which in this case would be Attrition. This variable is binary, with values YES and NO. Rather than reporting only a label, we want the model’s estimated probability of departure. We will compare several classifiers to see which works best on these data. This probability does not measure a person’s emotional burnout or health.
RandomForestClassifier {0:{'train_time': 0.4280989170074463, 'pred_time': 0.05773425102233887, 'acc_train': 1.0, 'acc_test': 0.9271255060728745, 'f_train': 1.0, 'f_test': 0.923076923076923}}
AdaBoostClassifier {0: {'train_time': 0.36793017387390137, 'pred_time': 0.08242297172546387, 'acc_train': 0.9259634888438134, 'acc_test': 0.9109311740890689, 'f_train': 0.9255102040816326, 'f_test': 0.9083333333333333}}
GaussianNB {0:{'train_time': 0.008366107940673828, 'pred_time': 0.025140047073364258, 'acc_train': 0.8078093306288032, 'acc_test': 0.771255060728745, 'f_train': 0.8265446224256293, 'f_test': 0.7911275415896488}}
Based on the result of the accuracy_test, we are going to continue working with Random Forest Classifier, which in addition to having had better performance, has the characteristics of Feature Importances and predict_proba
Using Feature Importances We can see which are the variables that, according to the model, are the ones that most influence its prediction.
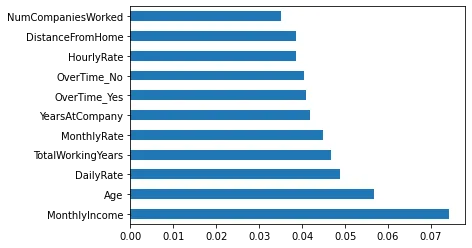
Feature Importances by Random Forest Classifier
Dataset expansion:
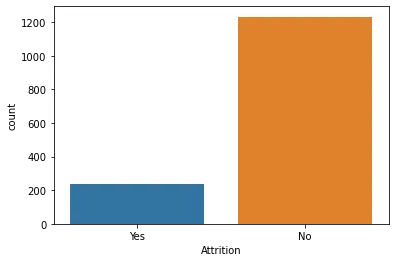
Yes 16%, No 84%
The dataset is imbalanced: 16% of the 1,470 rows represent employee departures. We use SMOTE to generate synthetic examples of the minority class. Oversampling should be applied only to the training set; balancing classes does not by itself guarantee greater accuracy or remove bias.
Shape of X before SMOTE: (1470, 51)
Shape of X after SMOTE: (2466, 51)
Balance of positive and negative classes (%):
Not 50.0
Yes 50.0
After training the Random Forest Classifier model with the expanded dataset, we are going to see what its predictions are in probabilities for each column of our dataset.
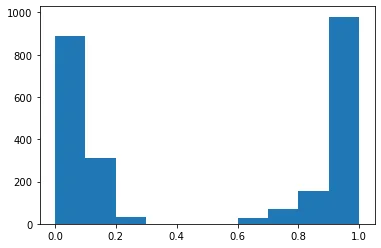
Estimated probability of departure, from 0 to 1
0 0.72
1 0.03
2 0.93
3 0.20
4 0.08
...
2461 0.99
2462 1.00
2463 0.99
2464 0.99
2465 0.95
The estimated probabilities let us compare how the model responds when each profile’s variables change. This is a sensitivity analysis of the model: it does not establish that changing pay or working conditions causes a real reduction in departures.
Exploring possible changes to working conditions
In this part we are taking into account the variables in which the company can intervene directly, such as salary, overtime, etc. Not those that are personal, because they would require third-party consents or more complex procedures.
In the first experiment, we increase the salary inputs by 10, 20, 30, 40, 50, 60, 70, 80 and 90% to observe how the model’s estimated probabilities change.
The following histograms show how the predictions change as salary inputs increase.
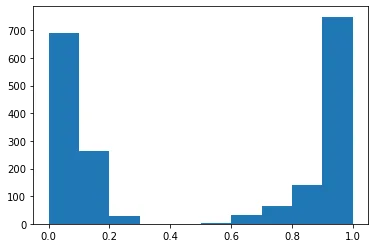
10% increase in Monthly Income
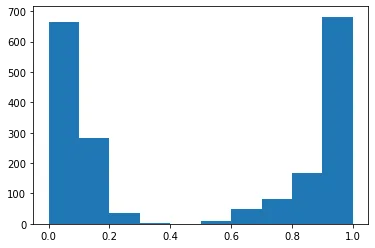
20% increase in Monthly Income
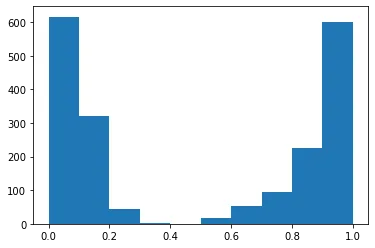
30% increase in Monthly Income
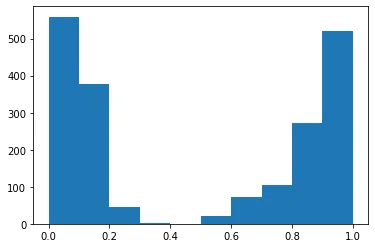
40% increase in Monthly Income
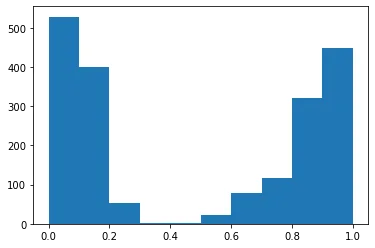
50% increase in Monthly Income
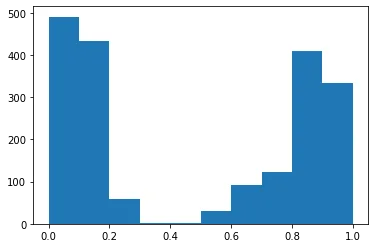
60% increase in Monthly Income
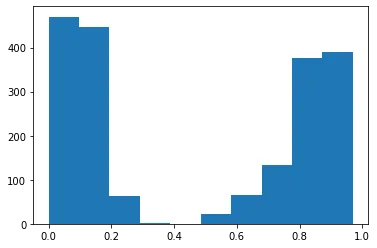
70% increase in Monthly Income
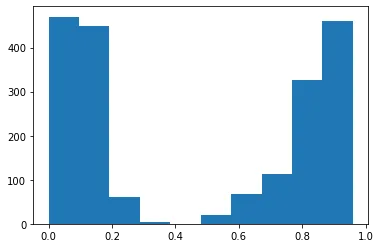
80% increase in Monthly Income
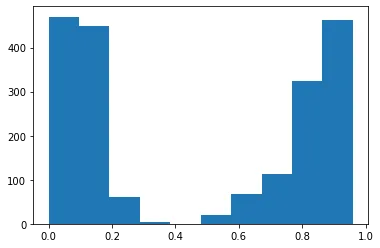
90% increase in Monthly Income
In this experiment, the number of profiles classified as staying increases only slightly, even with large salary increases. This describes the model’s response, not the economic effect of an actual pay policy.
We therefore designed a second experiment using two individual profiles with a high estimated probability of departure. We will change some variables in each profile to observe the model’s response.
As the first candidate we have taken a row with Attrition high and put him candidate_1
candidate_1['Attrition']0.76
To observe how the estimated probability of departure changes, we modify MonthlyIncome and OverTime. In this case we have increased his monthly salary by 10% and we have eliminated the need for overtime.
candidate_1['MonthlyIncome'] = candidate_1['MonthlyIncome'] * 1.1
2230.8candidate_1['OverTime_No'] = 1
candidate_1['OverTime_Yes'] = 0
By changing these values and passing it as input to the Random Forest Classifier, we can see the new probability of Attrition that it gives us.
prob_candidate_1 = clf.predict_proba(candidate_1)[:,1]0.47
The estimated probability falls from 0.76 to 0.47. This is a change in the model’s prediction; it does not indicate a change in the person’s health or wellbeing.
We will do a second example, this time with an employee who is not working overtime.
Example with candidate 2
candidate_2['Attrition'] 0.76
For this second example, we have chosen MonthlyIncome and StockOptionLevel. In this case we have increased his monthly salary by 10% and we have given him a level 2 participation option within the company, so that he feels like a participant.
candidate_2['MonthlyIncome'] = candidate_2['MonthlyIncome'] * 1.1
3256.00candidate_2['StockOptionLevel'] = 2
By changing these values and passing it as input to the Random Forest Classifier, we can see the new probability of Attrition that it gives us.
prob_candidate_2 = clf.predict_proba(candidate_2)[:,1]0.49
In this second example, the estimated probability falls from 0.76 to 0.49 after the inputs are changed.
Conclusions
This exercise led us to explore departure probabilities alongside yes/no labels. However, neither output measures a person’s emotional state or establishes which intervention would improve their situation.
That is why we have chosen to approach the project in a more proactive way that can help change people's situation before it is too late and also help make these decisions in an informed way.
The project shows how a classifier can help explore attrition patterns and the sensitivity of its predictions to different variables. It does not validate that the simulated changes reduce attrition in a real company. Studying that effect would require appropriate data and evaluation of the interventions, alongside listening to the people involved.
Next steps would include improving model evaluation, checking probability calibration and testing whether the results hold on new, representative data.
here in project repository.
Thank you.Saturdays.AI
Repository
In the following repository you will find the code used to develop that application: https://github.com/SaturdaysAI/Projects/tree/master/Donostia/Donostia2021/HUMANDS-master
More Artificial Intelligence!
Saturdays.AI makes AI more accessible through shared learning and projects with a social purpose. Our motto is AI4ALL IS AI4GOOD.
A story from the Saturdays.AI community. Originally published on December 31, 2021.
← More community stories