Anxietweet AI: Stress detection in tweets using Artificial Intelligence
Stress detection in tweets during the SARS-CoV-2 (COVID-19) pandemic Latam online. First Edition 2020 Stress: a silent 'epidemic' that can affect anyone during the modern era, now it is more noticeable...
A learning project shared by the community. The article documents its team, methods and results; it does not establish that the prototype is ready for real-world use.

Detection of stress in tweets during the SARS-CoV-2 (COVID-19) pandemic
Latam online. First Edition 2020
Stress: a silent 'epidemic' that can affect anyone during the modern era, is now more noticeable due to the largest health crisis faced during this century. The levels of worry, economic and emotional impact that people have had to face have been factors that have impacted not only the physical health but also the mental health of millions of people.
This project explores classifying Twitter texts using automatically generated stress labels. The model learns those labels; it does not determine the mental state of the person who posted a message.
General problem
Is it possible that a machine can determine if a person is stressed from written expression alone?
Motivation
Social: explore language patterns related to stress during the health crisis, without replacing individual assessment or assuming the messages represent the whole population.
Professional: obtain, extend and apply knowledge about data science and artificial intelligence, in human language analysis and emotion recognition
Methodology
The methodology used in this project is based on the traditional methodology of CRISP-DM [1]. Below is the general diagram of the steps that were carried out in this work.

Recognition model design:
Data collection
To carry out the analysis, tweet data from 3 different cities was collected in order to have varied samples and expect different results. The cities were chosen only taking into account that they were large cities in different English-speaking countries.
The cities from which the data was obtained were the following:
- Brisbane, Australia (2225 tweets)
- San Francisco, United States (5000 tweets)
- Vancouver, Canada (1699 tweets)
The data were collected on 24 October 2020 and included tweets published during the preceding seven days and on the collection date.
The keywords that were used for collection were the following:
covid OR COVID OR coronavirus OR corona OR coronavirus OR #coronavirus OR #covid19 OR covid19 OR sarscov2 OR #covid-19 OR #sarscov2 OR sars OR cov2 OR sars OR #quarantine OR pandemic OR #pandemic OR #2019ncov OR 2019ncov OR quarantine OR lockdown OR #lockdown OR social distancing OR #socialdistancing OR #COVID OR #covid”
The data structure is identical for the 3 datasets. Each dataset is organized in 3 columns:
- user_location: Approximate location of the user (if location is enabled).
- date: Date of publication of the tweet.
- text: Text of the tweet.
The anonymized data was obtained through the Twitter API via a Python script using Tweepy [2].

Labeling
To label the data, a tool called TensiStrength, which is developed in Java, and helps evaluate the level of relaxation or anxiety that can be found in a simple text. This tool works through emotion dictionaries in which values are assigned to positive or negative words and at the same time it also has a dictionary of words (booster words) that increase the value of the expression/emotion.

TensiStrength manages to catalog texts in two available ways, binary or ternary; the ternary classifies them into 1, 0, -1, positive, neutral and negative respectively. The scheme for classifying emotions used in our model uses binary type classification, which consists of using labels 1 and 0, which correspond to “stress” and “not stress.”
Distribution of automatic labels: “stress”, 49.972%; “no stress”, 50.028%.
Stressed tweets = 49.972%
Stress-free tweets = 50.028%
Data exploration:
Number of tweets with stress.
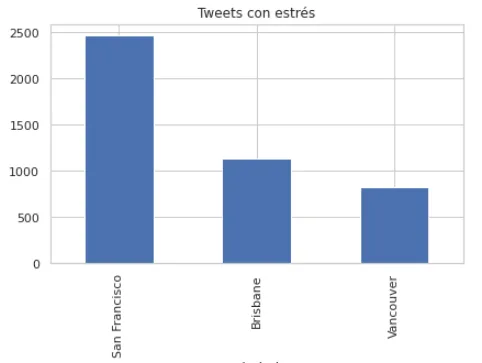
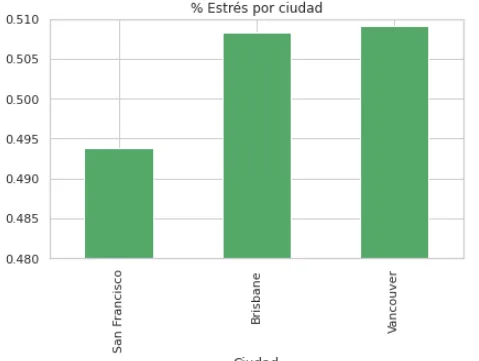
Percentage of stress by city, represents the number of tweets with stress compared to the total number of tweets.
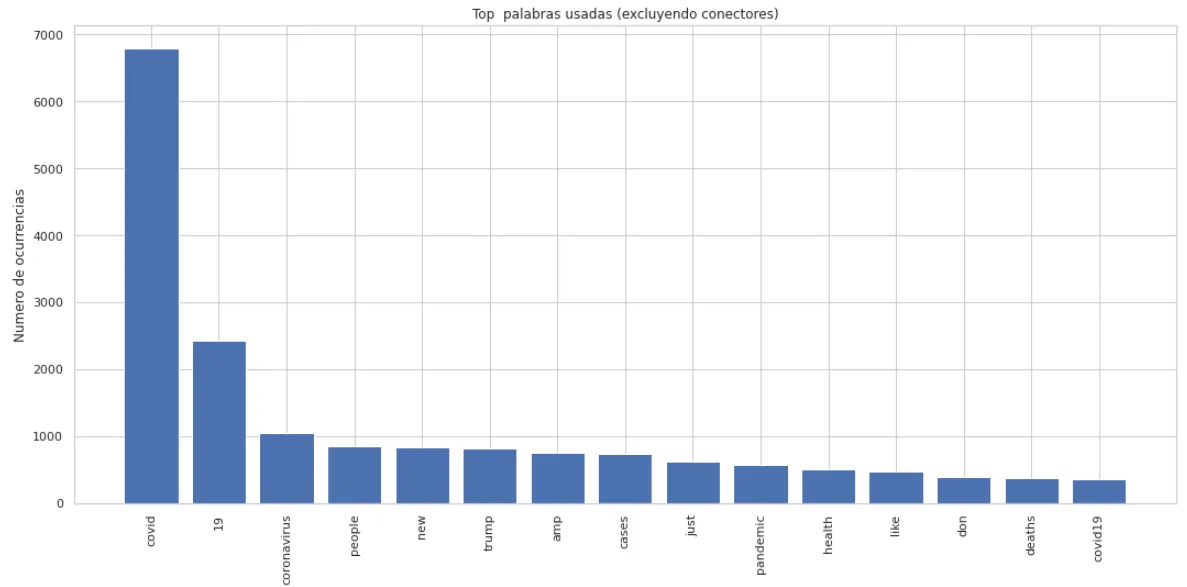
Words most used in tweets, excluding connectors.
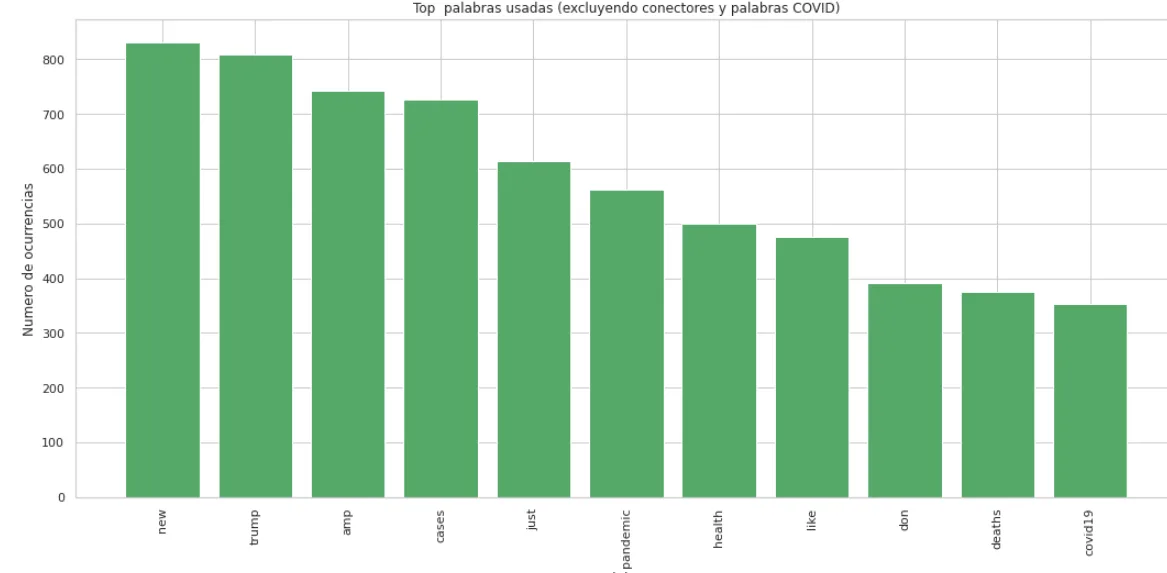
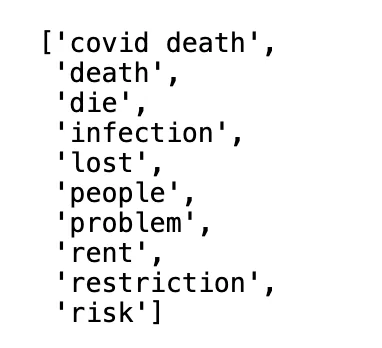
Words most used in tweets, excluding connectors and words related to Covid.
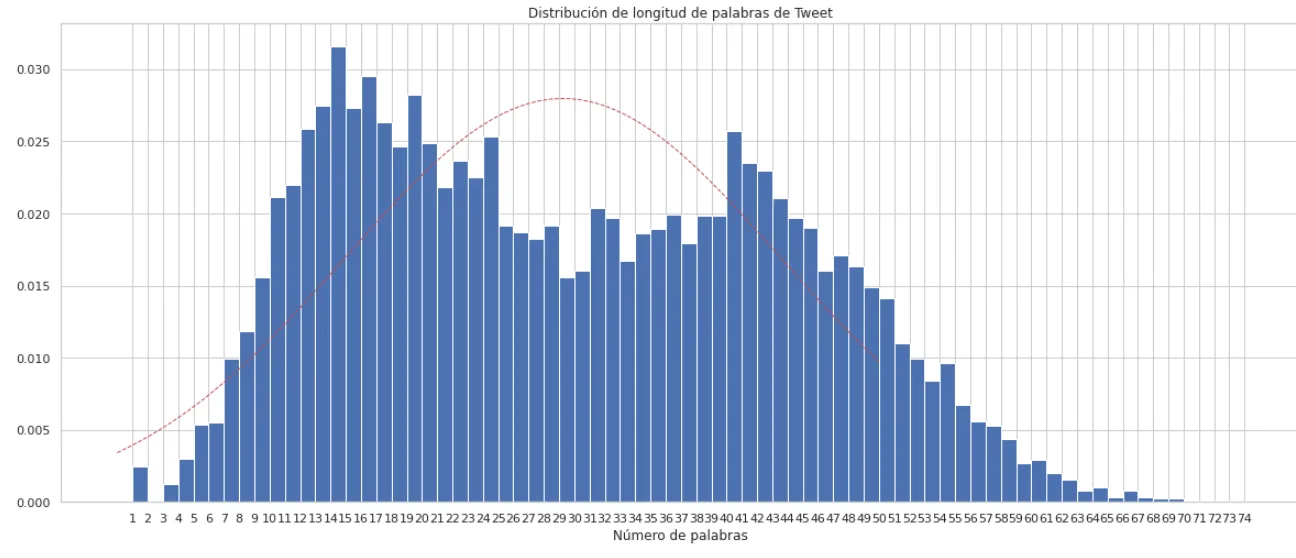
Distribution of words in Tweets according to their length
Data pre-processing:
After collecting the data, pre-processing was carried out so that the data could be used to train a classifier model. This step is one of the most important and is the one that typically consumes the most time in a machine learning project.
- Noise Reduction: Extra spaces, special characters and links to other pages were eliminated.
- Normalization: characters were transformed to lowercase, punctuations were removed, and contractions were expanded.
- Stopword removal: Those words that do not have a meaning by themselves were removed (articles, pronouns, prepositions and some verbs)
- Lemmatization: Lemmatization was carried out, which consists of converting the word to its base form (i.e. tables to table).
- Tokenization: Finally the texts were separated into words, also called tokens.
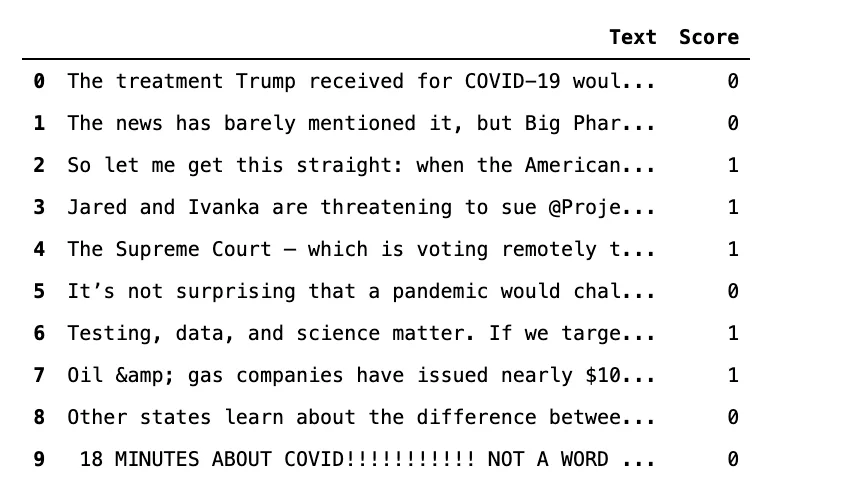
Before pre-processing, the text is displayed as follows:
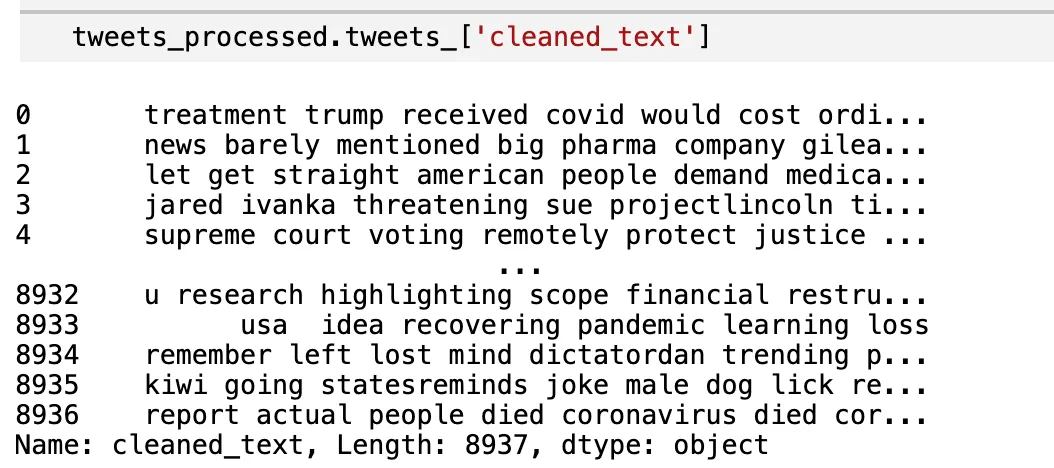
After cleaning and prior to tokenization, the text is displayed as follows:
Data visualization
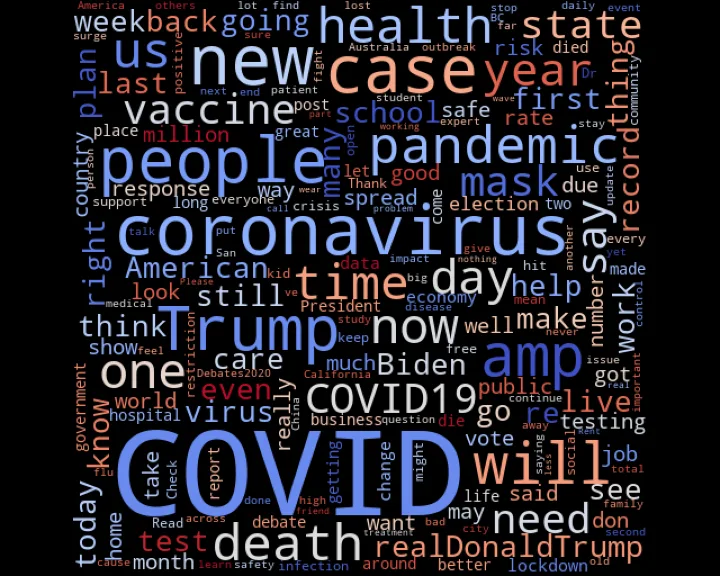
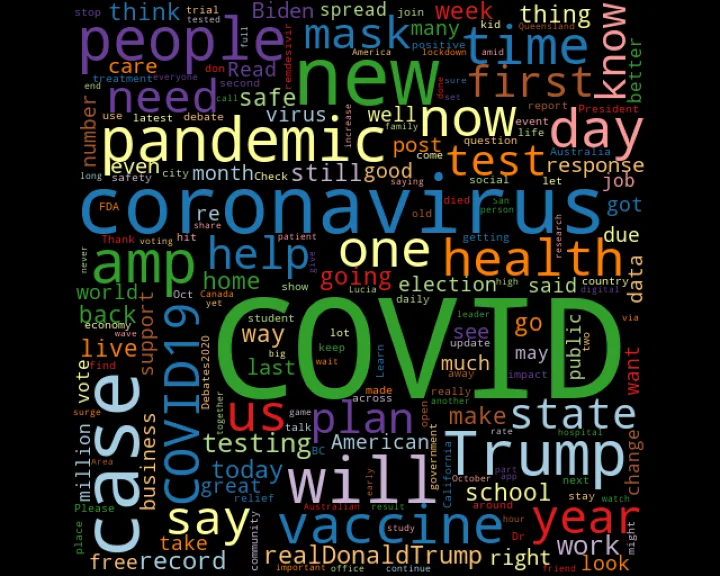
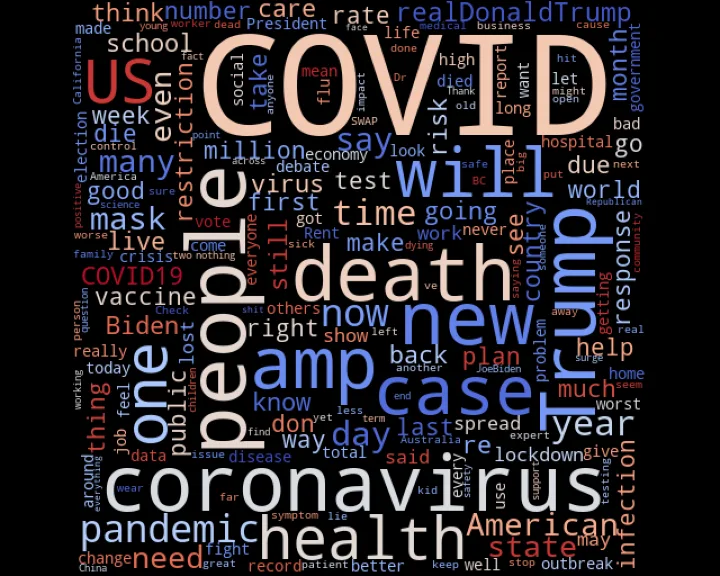
It was carried out through word clouds, in general and dividing the data by class.
Most recurring words in general:
Most recurrent words within the data classified as NO stress
Most recurrent words within the data classified as WITH stress
LDA (Latent Dirichlet Allocation)
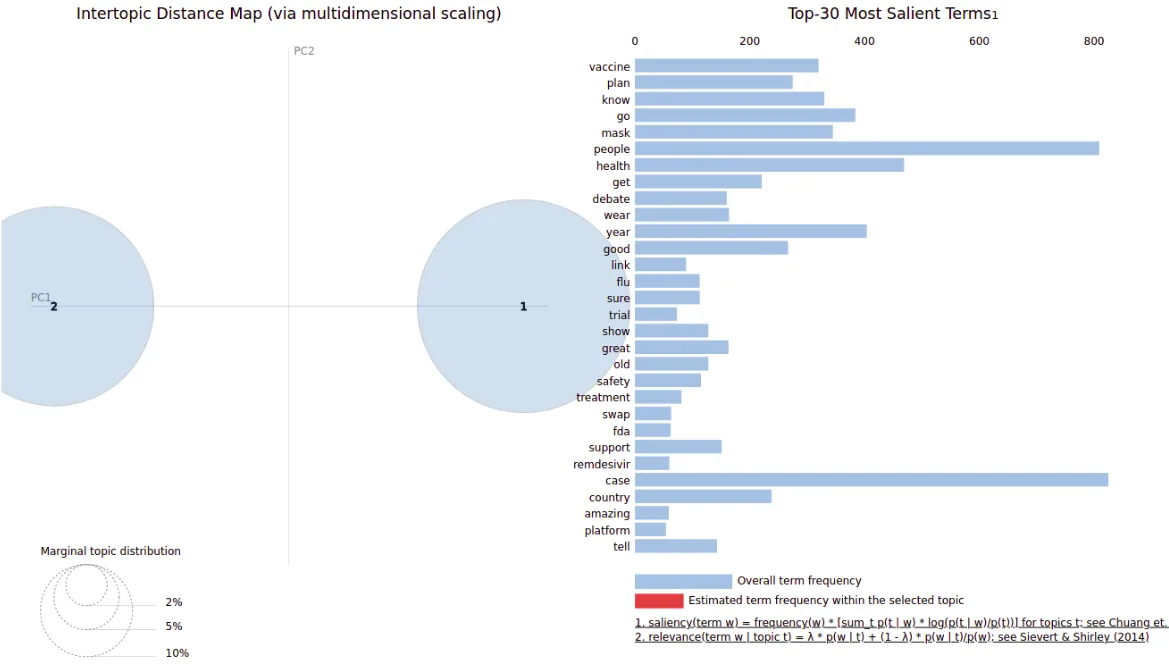
We used LDA (Latent Dirichlet Allocation), an unsupervised probabilistic topic model. It explores groups of words that tend to occur together in documents. Here, it was used to analyse topics in the corpus, not to diagnose stress.
We tokenised and vectorised the cleaned tweets and fitted a two-topic model. Its main words were:
Obtaining a classifier of 2 topics, in which the main words were:
Topic 0: Covid case new health vaccine death year trump plan day
Topic 1: Covid people trump go new case mask know say need
and using the pyLDAvis library
The viewer was obtained:
Modeling
Five models of Machine Learning were evaluated for this project. As a base model, Naive Bayes was used and compared with:
- Logistic Regression
- K-Nearest Neighbors
- Random Forest
- Gradient Boosting.
For the vectorization [4] of the tweets, two techniques were evaluated: Bag of Words and TF-IDF (term frequency — inverse document frequency) and two strategies for their n-grams: Bigram and Trigrams [5].
The results were measured by means of the AUC (Area Under the Curve) and were evaluated with cross validation (k = 10). Both the preprocessing, training and evaluation of the model were carried out within a “pipeline” created within a class using the Python programming language.
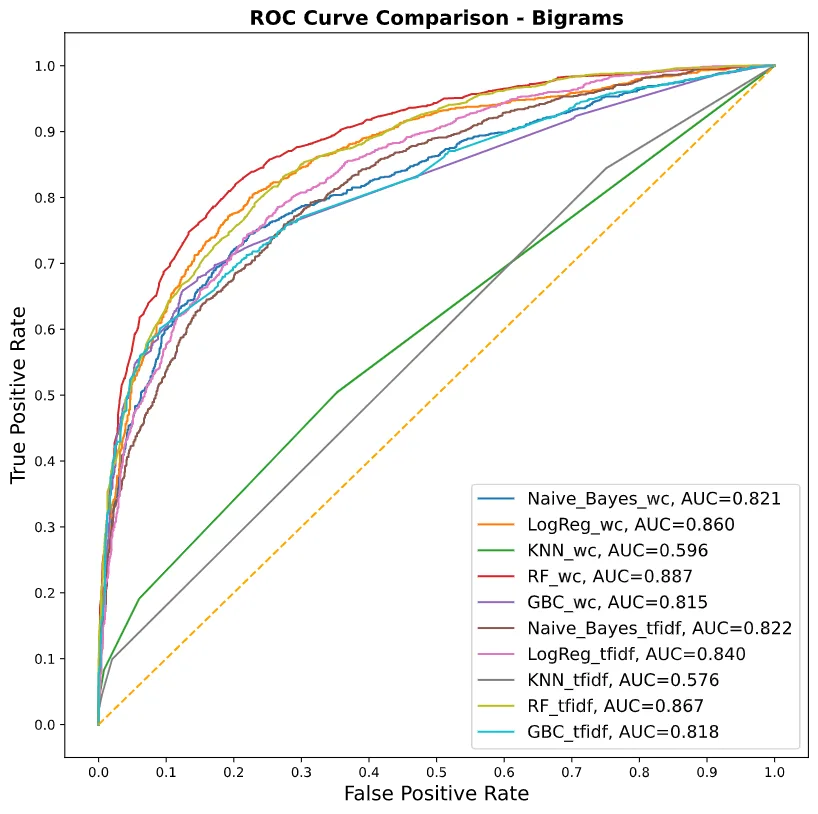
Precision level for each model implemented with “Bigrams”
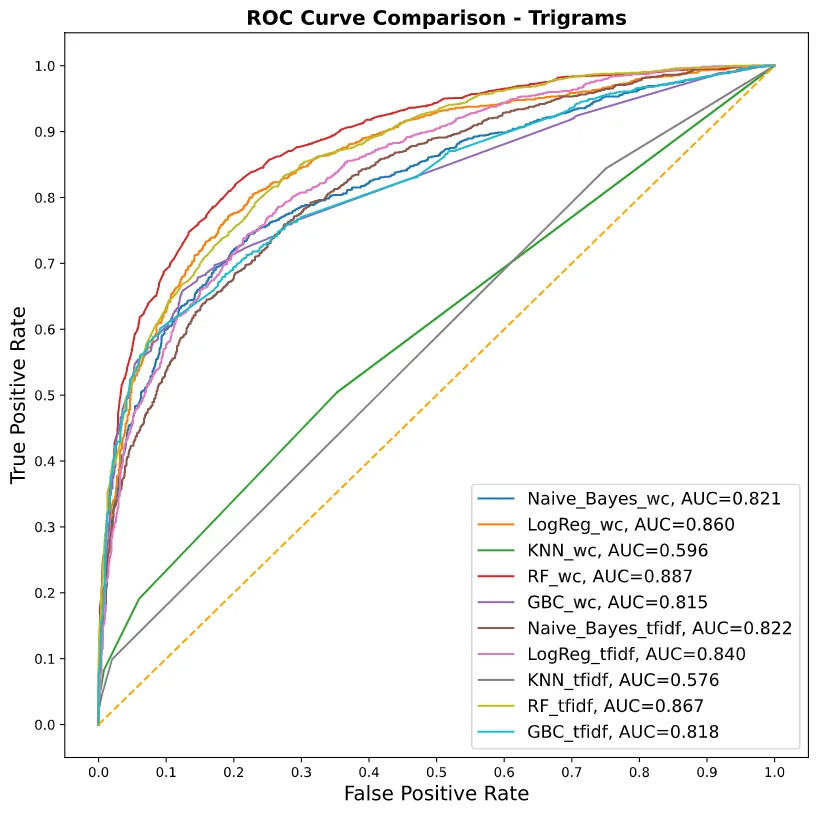
Precision level for each model implemented with “Trigrams”
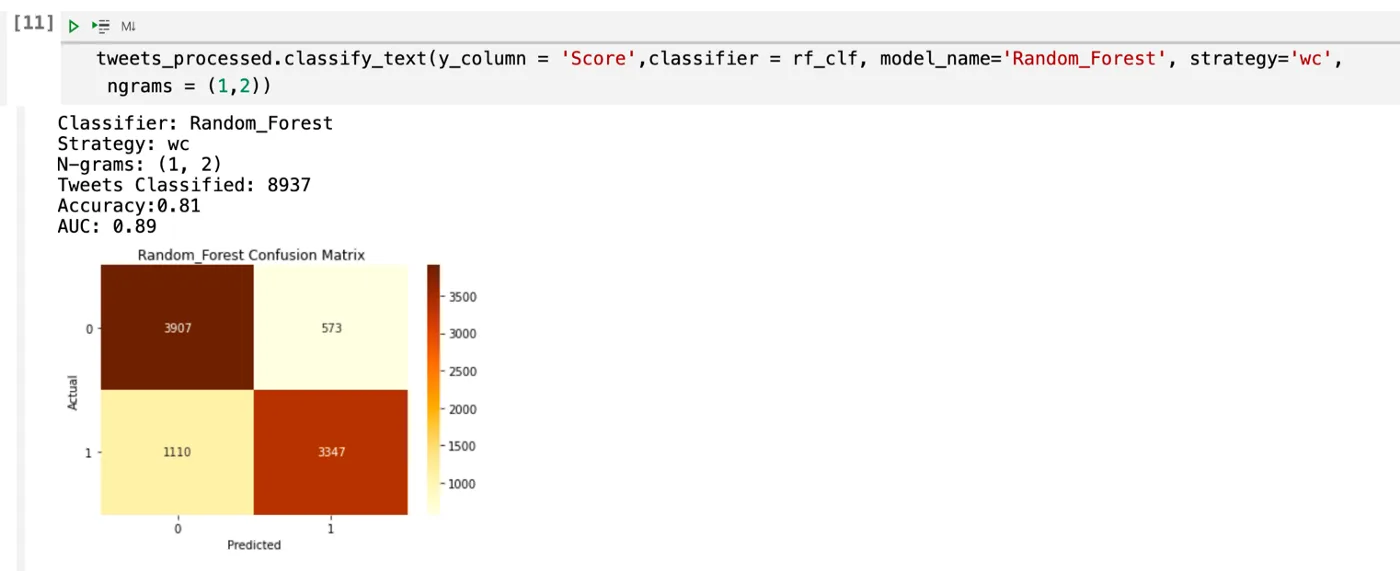
The previous AUC graphs show that the winning combination is: RFt + BoW + Bigrams, since it is the best at discerning messages that have some relationship with stress from those that do not.
Below we can see the confusion matrix of the winning model, as well as the results of its metrics.
Optimization ('Tuning') of the model:
The adjustment was carried out for three models in order to improve their performance.
Logistic Regression
A grid search runs the model with a set of parameter values to find the configuration with the highest accuracy. The following parameters were considered:
1.- C value
2.- Penalty of the model: L1 (Lasso) and L2 (Ridge)
Random Forest Classifier
A grid search runs the model with a set of parameter values to find the configuration with the highest accuracy. The following parameters were considered:
1.- Number of Estimators: number of trees used in the forest. This value will start at 200 and go from 10 by 10 until it reaches 2000.
2.- Max_Features: is the number of attributes to consider for the best division. It is tested with “auto” which means that the maximum number of attributes will be the square root of the number of attributes.
3.- Max_depth: this refers to the maximum depth of the tree. In this case, it starts from 10 to 110, advancing from 11.
4.- Min_Samples_split: is the minimum number of samples required for the internal division of the node. It is tested with 2, 5 and 10.
5.- Min_samples_leaf: the minimum number of samples required to be a node leaf. 1, 2 and 4 are considered to perform the grid search.
6.- Bootstrap: If True, it will use bootstrap in the construction of the trees. If it is false it will not be used. Will try both.
Gradient Boosting Classifier
A grid search runs the model with a set of parameter values to find the configuration with the highest accuracy. The following parameters were considered:
1.- Loss: deviation is used to evaluate the loss function as logistic regression
2.- Learning:rate: is the measurement that measures the contribution of each tree.
3.- Max_Features: is the number of attributes to consider for the best division. It is tested with “sqrt” which means that the maximum number of attributes will be the square root of the number of attributes, in the case of “log2” the logarithm of the number of attributes is used.
4.- Max_depth: this refers to the maximum depth of the tree. In this case 3, 5 and 8 are used.
5.- Min_Samples_split: is the minimum number of samples required for the internal division of the node. It is tested with a linspace of 0.1, 0.5 and 12.
6.- Min_samples_leaf: the minimum number of samples required to be a node leaf. It is tested with a linspace of 0.1, 0.5 and 12.
7.- Number of Estimators: number of trees used in the forest. This value will start at 200 and go from 10 by 10 until it reaches 2000.
Evaluation:
Random Forest performed best in the comparison, achieving 88% accuracy against the labels used. Those labels came from TensiStrength, not clinical assessment. The result therefore measures reproduction of an automatic text classification; it does not validate the detection or treatment of stress or depression in people.
Analysis of results:
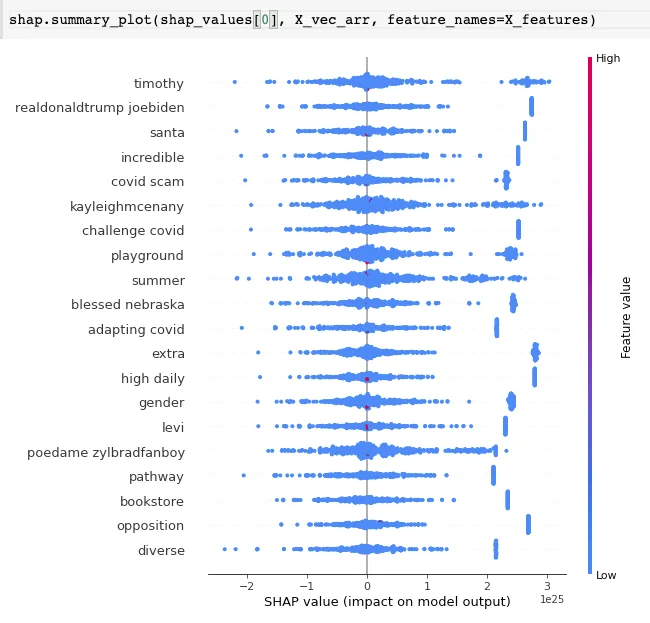
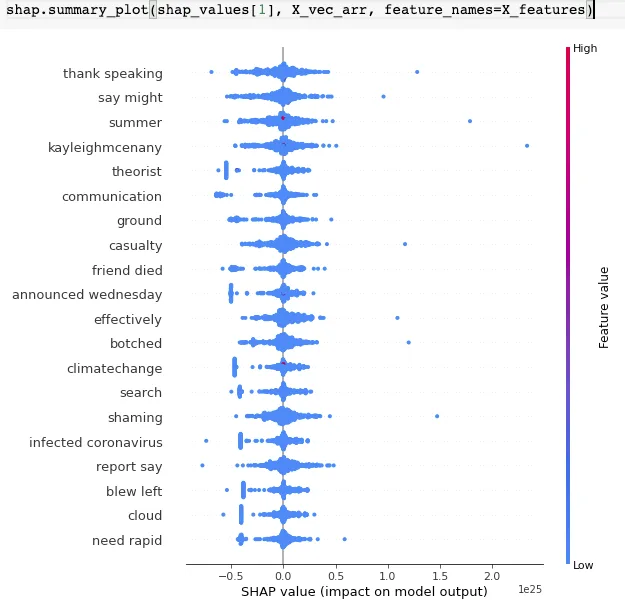
In order to delve deeper into why the model behaves the way it does, we made use of SHAP, a game theory technique used to explain models. The model used was a Random Forest with 100 estimators.
In this case we use a TreeExplainer from the shap library. To calculate these values, only 5% of the training data and 10,000 features had to be used, otherwise the execution time exceeds an hour and a half in Google Colab.
Results for tweets that have NO stress:
Results for tweets that DO have stress:
Use cases for the generated model:
Exploratory research into language patterns in aggregated corpora. Any institutional use would require assessment of bias, representativeness, privacy and consent.
Collaboration with mental health professionals to study the approach’s limitations; the prototype cannot assess a population’s emotional stability.
Possible studies of mental health communication, without assigning diagnoses or emotional profiles to individual users.
Model Development in a Web App
To host our Machine Learning model we use the Flask framework. This is used for its ease of use, being very scalable and is also developed for Python. Which allows all development to be carried out in one language. It must be clear that a web application has two fundamental parts.
Parts of a Web App:
- The Front-end which is a page developed with Html and CSS. Without any part of JavaScript since it is a simple app to use.
- The Back-end will be developed with Flask, where it allows creating the integration with the Front-end and also running the already trained model.
User interface development
In this part, two very useful online tools were used: Flask and Heroku.
Flask is a framework for web development with great interaction with Python; Heroku is used as a server for the deployment and public availability of the application.
The application is available at:
Members
- Elías Garcés (Civil Eng.)
- Daniela Gómez (Industrial and Systems Engineer)
- Enrique Ramos García (Lic. in Mathematics)
- Fernando Vizcarra Salva (Mechatronic Engineer)
- Jonathan Chávez (Web Developer)
Project presentation: DemoDay
Repository
In the following repository you can find the code used to develop this application: https://github.com/SaturdaysAI/Projects/tree/master/LATAM\_remote/DataExtraction-master
More artificial intelligence!
Saturdays.AI makes AI more accessible through shared learning and projects with a social purpose. Our motto is AI4ALL IS AI4GOOD.
A story from the Saturdays.AI community. Originally published on March 16, 2022.
← More community stories