
Student Experience: how to improve the learning experience at university
A Saturdays.AI project analyses over 20,000 university surveys to explore the relationship between teaching, student satisfaction and grades.
A learning project shared by the community. The article documents its team, methods and results; it does not establish that the prototype is ready for real-world use.

learning artificial intelligence
Donostia. 2021
How would you rate your learning experience at university? Can you explain what makes you more satisfied with a particular teacher?
It can be difficult to put our experiences into words. What one person feels may be very different from what another feels, making common patterns hard to identify. Yet most of us can fondly remember a teacher from our school years who made a lasting impression.
Wouldn’t it be useful to understand why that teacher made our experience so positive? And for teachers and programme coordinators to take that into account when assessing teaching?
And let’s be honest: alongside the experience, we care about the outcome. Final grades are a powerful source of external motivation. So wouldn’t it also be useful to understand what helps a teacher improve a class’s academic results? We want students to feel satisfied and fulfil their potential. With university so close to the world of work, this is particularly important.
Why we took on this project
When we began exploring these questions, we assumed most had already been answered. Yet measuring the university experience did not seem central to public debate, and rankings seemed more concerned with MBA programmes than with student satisfaction.
So, at Saturdays.AI Bilbao two university students (Gorka Legarreta Ibarra and Rubén García Pedrejón) and I, a university lecturer, (Iñaki Fernández López-Zuazo), got to work. All three of us have an obvious interest in improving both the learning experience and academic results. Speaking personally as a lecturer, I find it frustrating when everyone assumes they know the best way to teach. We wanted to reach conclusions based on data rather than simply add another opinion.
None of the three of us had any programming experience. But with practice, more practice, and a little Ctrl+C and Ctrl+V, we reached some interesting conclusions.
If you’re a student, would you like to know what to ask of your university to improve your experience and results?
If you’re a university teacher, would you like to know where to focus your efforts to improve your teaching?
The dataset
Data is essential, but finding a dataset detailed enough for a useful analysis was difficult. A university kindly provided one, anonymising identifying attributes and applying multipliers to some values to make identification harder. According to our comparison, the original and modified datasets led to the same conclusions. We used student comments in the analysis but later removed them because they could identify individual teachers and situations.
This dataset contains information on more than 20,000 satisfaction surveys carried out on students from February 2015 to December 2020. The survey information has been completed with identifying data of the teacher who taught the subject and the average grade of the group.
The main information we analysed was:
Answers to specific satisfaction questions: Students rated the teacher’s knowledge, explanations, classroom methods and feedback, then gave an overall rating.
Average grade: Each record contains the average academic grade for the respondent’s whole class, not that individual student’s grade.
Teacher characteristics and subject: Sex, age, usual campus, type of subject taught…
EDA: How right they were...
In the first sessions of Saturdays.AI we were repeatedly told how important data cleaning is and how it can take over 80% of a project’s time. That sounded exaggerated, but in our case it may have been closer to 90%! 🙂
Here are the main changes we made:
- Removing records with NaN values: because the dataset was large, we kept only complete records rather than imputing missing values.
- Focusing on one degree programme: we had data from several programmes, but most were incomplete and lacked the grades essential to our analysis. We therefore focused on a single programme.
- Standardising and removing attributes: in one year, the programme switched to co-teaching, with three teachers per classroom. Students rated all three, which created some challenges when standardising the dataset. We resolved them with plenty of effort and persistence. 🙂
- Categorising attributes: for later analysis, we grouped satisfaction ratings using Net Promoter Score categories: detractors (0–6), passives or neutrals (7–8), and promoters (9–10). We also grouped academic grades as fail (0–4.9), pass (5–7.9), and outstanding (8–10).
Exploring the data: reaffirming intuitions
With the dataset ready, we started with a heatmap showing correlations between variables:
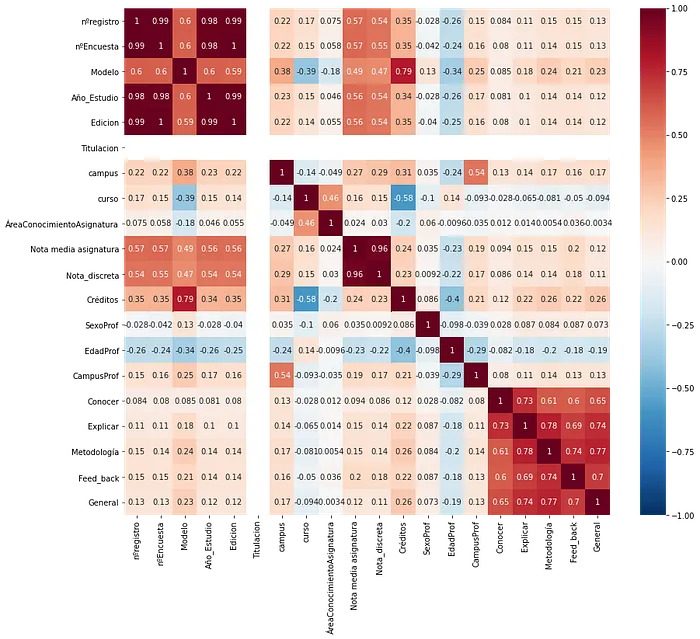
Teaching methods showed the strongest correlation with overall teacher ratings, closely followed by explanations and feedback; perceived knowledge showed the weakest. This suggests that subject knowledge alone may not be enough to create a good learning experience. We also observed a correlation between knowledge and explanations. These are associations within this sample, not evidence of causation.
We also explored how ratings varied by teachers’ sex and age:
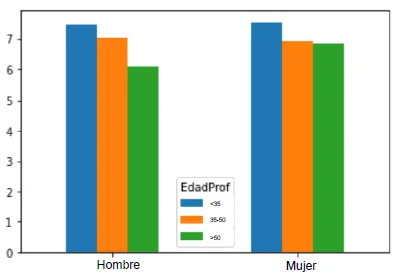
In this sample, younger teachers generally received higher ratings. Differences between sexes were small, although women over 55 received higher ratings than men of the same age. These descriptive differences do not show that age or sex determines teaching quality.
Finally, we explored length of service at the university. Teachers were ordered by when they joined the faculty, so we plotted that order against satisfaction ratings.
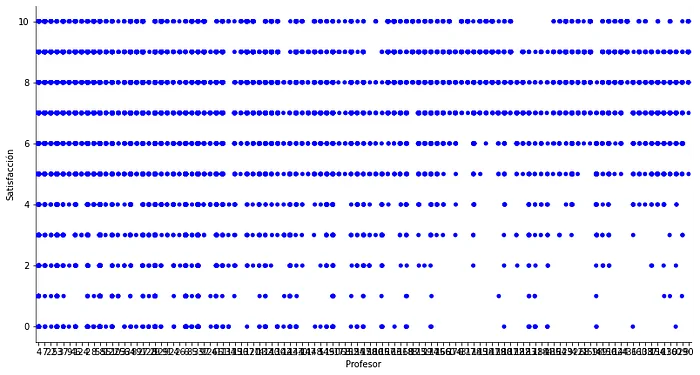
Newer staff appeared to receive fewer negative ratings than longer-serving colleagues, but they also received fewer perfect scores.
Now that we have some ideas about the dataset, we move on to the models.
From supervised to unsupervised learning, with a first taste of NLP
We used four modelling approaches and a text analysis, each with a different goal.
-Linear regression: To be able to predict general satisfaction if we have the 4 satisfaction items, and know the importance of each of them.
-Association rules: to identify attributes that tend to occur together.
-Decision Trees: To easily classify promoters/detractors/neutrals.
-Clustering: To identify the relationship between grade and satisfaction, and most importantly, describe the groups of teachers that are formed.
-NLP: To know which comments are repeated the most according to satisfaction and the group's grade.
Linear regression
We chose the 4 satisfaction variables as independent variables, and general satisfaction as the dependent variable of the model. We assumed, given the correlations, that we were going to have good results.
Ridge regression produced a reported score of 0.67. The original article called it “accuracy” but did not document the regression metric used, so it should not be read as 67% correct predictions. We also examined the relative importance of each variable. Any model improvements would need to be evaluated without tuning to the test data.
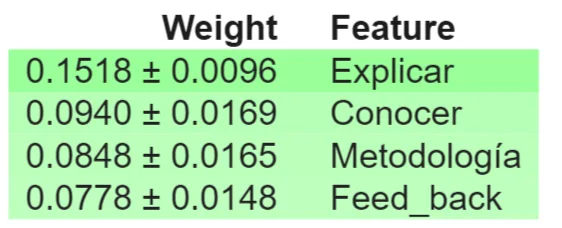
In our model, ratings of teachers’ explanations had the greatest weight. That is a useful clue when considering teaching improvements, although the model alone does not prove that changing explanations will improve outcomes.
Association
To explore the relationship between class grades and teacher ratings, we used the Apriori algorithm. These are the associations with lift greater than 1: combinations occurring more often than expected if the variables were independent.
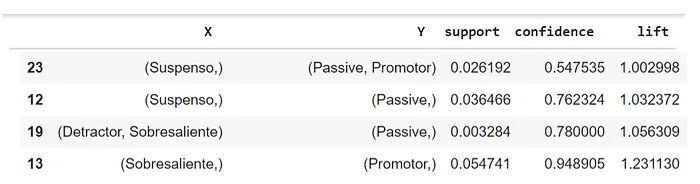
The association with the highest lift and confidence linked “outstanding” grades with “promoter” ratings. In this sample, classes with outstanding average grades tended to rate their teachers highly; the reverse relationship was less clear. Nor can we infer that low grades imply poor teaching.
To go deeper into what makes that teacher have promoters or detractors, we start with the decision trees.
Decision Trees
The first test we did was with a depth of 2, to begin to see the first results.
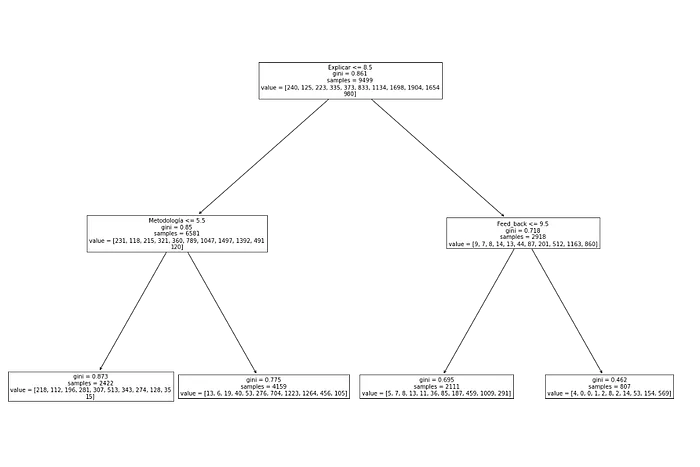
The tree again identified explanations as an important factor in distinguishing promoters from detractors or neutrals. Teaching methods and feedback also appeared in its rules. These are exploratory patterns that can guide further questions, not recipes guaranteed to improve ratings.
But hey, the score of the tree is 0.35, so you have to take the result with some skepticism.
Increasing the depth to 5 introduced new variables and raised the score to 0.45. One interesting observation was that, when feedback was rated poorly but perceived knowledge was high, the proportion of promoters increased.
Given all this, we are going to focus on what the teachers are like according to the satisfaction of the students and the grades they give.
Clustering
We applied K-Means and selected a six-cluster solution, then plotted the relationship between grades and satisfaction:
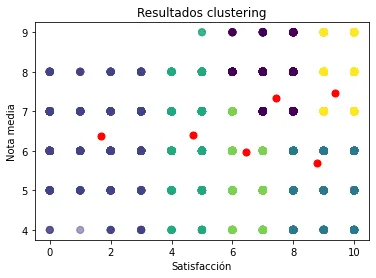
We have 6 different groups, but we are going to focus on 3 of them:
- Teachers with only detractor ratings, regardless of class average: in this sample, the profile included teachers over 55 from western Gipuzkoa whose knowledge was rated positively but whose teaching methods received lower ratings. This describes one cluster and cannot be generalised to all teachers of that age.
- Teachers who only receive promoter ratings, although their classes average below 6: the profile included teachers aged 35–55 who taught finance, came from eastern Gipuzkoa and were rated highly for their knowledge. Feedback received lower ratings. This invites further investigation into its relationship with learning but does not show that it explains the class’s grades.
- Teachers who have mostly promoters and whose classes average at least 7: in this sample, they were under 35, taught strategy and received positive ratings for their knowledge and explanations.
To go a little deeper into how to classify these teachers, let's take a look at NLP.
NLP
As often happens, we reached the final stage with little energy left. Natural language processing (NLP) is a broad field, so we began with a simple approach: counting the most common phrases about aspects students wanted to keep. We grouped comments by teacher rating and class grades, producing the following observations.
Among detractors, positive comments tended to focus on teamwork: classmates, rather than the teaching itself, were often the highlight. Promoters more often praised the teacher’s knowledge, varied teaching methods and useful feedback on assignments.
When we grouped responses by grade, positive comments from classes with failing grades focused mainly on course materials. Classes with outstanding grades more often mentioned the teacher’s attentiveness, attitude, motivation and willingness to help.
Let's finish: 3 big conclusions
- Clarity of explanation was strongly associated with satisfaction.
- In this sample, classes that rated teachers more highly tended to achieve better results, although the association does not establish causation.
- Teachers’ attitude and willingness to help stood out in comments from classes with higher grades.
These are hardly earth-shattering conclusions, and they may not apply to other universities or contexts. But they give us a starting point. Improving explanations and attitudes is the harder part; at least teachers and students now have some clues about where to focus. 😉
One final theme stands out: attitude. It was mentioned far more often in comments from classes with outstanding grades. The pattern concerned academic results as well as satisfaction, though better grades do not necessarily translate into better outcomes later in life. That leaves us with two sets of questions.
For teachers and programme coordinators: are we doing enough to improve how we engage with students? Does bureaucracy take priority over the student experience?
For students: how ready are we to engage in learning? How much responsibility does the teacher have for motivating us, and how much motivation should we bring ourselves?
Future work
There is still much to do…
- A good NLP analysis, beyond counting the most repeated phrases. Lots of potential to extract value from more than 4,000 comments.
- Clustering: refine the teacher clusters and introduce student variables to explore further groupings.
- Beyond programming, establish a process to “close the loop”: turn survey results into decisions, concrete actions and follow-up projects.
Closing
On GitHub you will find the dataset and the different notebooks used in the project.
You can watch the project presentation here.
And finally, a thank you to the entire team at Saturdays.AI Bilbo. We went from counting rows in Excel to building a project we could proudly present. None of it would have been possible without this community. Mila esker denoi!
Thanks to Rubén García Pedrejón.
Repository
In the following repository you will find the code used to develop this application: https://github.com/SaturdaysAI/Projects/tree/master/Donostia/Donostia2021/StudentExperience-ResultsAI-main
More artificial intelligence!
Saturdays.AI makes AI more accessible through shared learning and projects with a social purpose. Our motto is AI4ALL IS AI4GOOD.
A story from the Saturdays.AI community. Originally published on July 29, 2021.
← More community stories


File comments