
BasketTracker.AI: artificial intelligence for grocery shopping
Latam online. First Edition. 2020 What is not measured cannot be improved... The ups and downs in prices are a phenomenon that we all experience daily. It is so everyday that many of us take it for granted that it is a situation...
A learning project shared by the community. The article documents its team, methods and results; it does not establish that the prototype is ready for real-world use.

Latam online. First Edition. 2020
What is not measured cannot be improved...
The ups and downs in prices are a phenomenon that we all experience daily. It is so everyday that many of us take for granted that it is a situation that we cannot change and that we only have to adjust our budget to the increases that occur.
Will it be possible to create tools that help us better adapt to the change in prices? We believe so.
In this article, we show how we developed a prototype to track online shop prices while learning about artificial intelligence.
Many times without knowing we buy goods whose price is increasing and according to the law of supply and demand, we only reinforce their upward trend when we consume these products. If, on the other hand, we knew how to replace these expensive items with lower-cost “equivalents,” in the long run we would help generate a lower price level.
So we set out to make a prototype to monitor these prices. From the first exchanges of ideas we had, we realized that there were several challenges that we had to overcome to achieve our purpose.
And where are the prices?
The first question we asked was what prices we were interested in collecting. We decided to start with some basic consumer items: (a) egg, (b) beans, (c) toilet paper, (d) coffee, and (e) tortillas.
Most surprising of all, most of the pricing information was within our reach. There are a large number of supermarkets that publish catalogs of their products online. For the initial phase we decided to extract the prices of items from two Mexican supermarkets: Soriana and Superama.
Our colleagues Gabriela and Gustavo worked on price extraction, using web scraping. Web scraping is a technique that allows you to automate the extraction of data hosted on web pages. In the following image we show the information that we want to extract from the website:
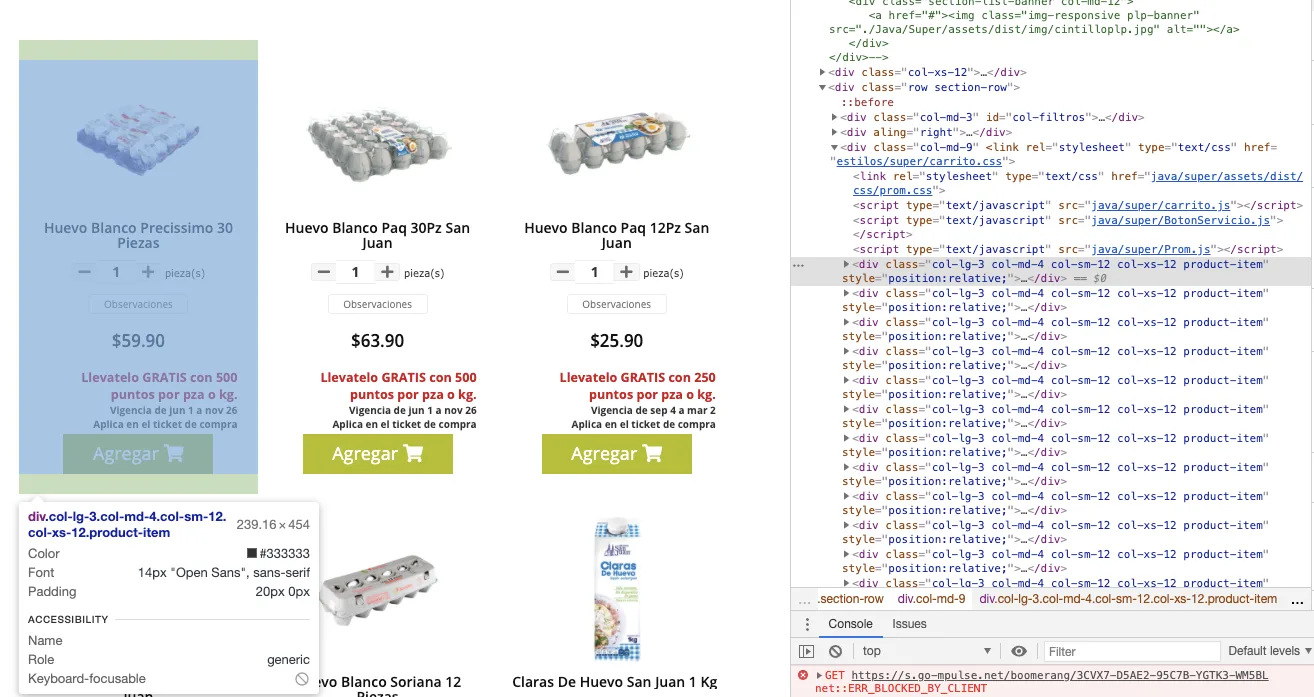
Screenshot of the Soriana site for the product “egg”
Using their data engineering skills, our AI fellows developed scripts with Python, Selenium and other tools to generate the first raw datasets (Raw Datasets):
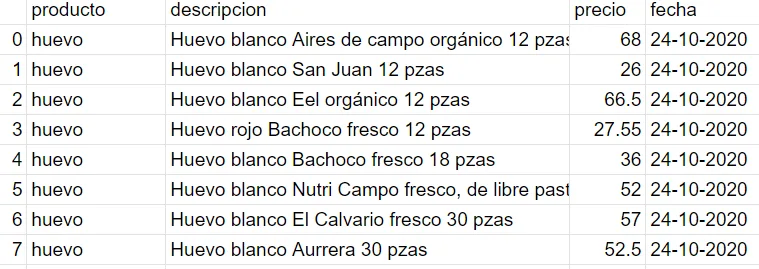
Raw Dataset Superama
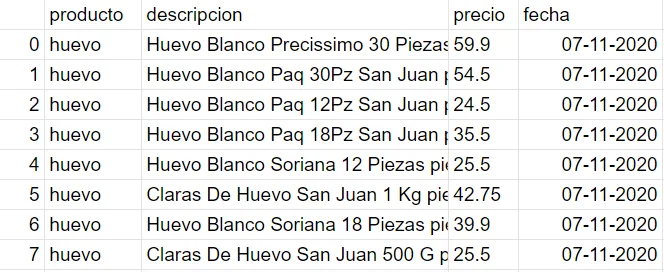
Raw Dataset Soriana
Among the main challenges faced were: (a) Simulate the behavior of a person. If the speed of generating queries to the website is faster than what an average user would do, sites usually block the scripts. Therefore, it was necessary to consider delays in consultations to avoid being blocked. (b) The structure of the websites, although similar, is different. It was necessary to make small adjustments for each of the sites.
Data integration with AI
When we reviewed the first Raw Data sets generated, we observed that it was necessary to work on standardizing nomenclature criteria between the Soriana and Superama sources, especially in the “description” field.
Ramón and Juan Esteban took the initiative to apply techniques of natural language processing (NLP) to integrate the Raw Data sets obtained from Soriana and Superama.
Our colleagues proposed to enrich the Raw Dataset with the following columns:
- Type: It is the main type of product. For example, “egg” can be a descriptor for any brand of egg.
- Type_2: product subcategory; for example, white and brown eggs.
- Brand: Information about the brand and sub-brand of each Type.
- Packaging: Packaging of each type.
- Content: Quantity of each Type in a Package.
- Unit of measurement: Corresponds to each quantity in Content.
The scripts they developed used the following Python libraries:
- Nltk
- Sklearn
- Fancyimpute
- pandas
- Numpy
- Unidecode
- Re
This diagram describes the steps to unify Soriana and Superama data:
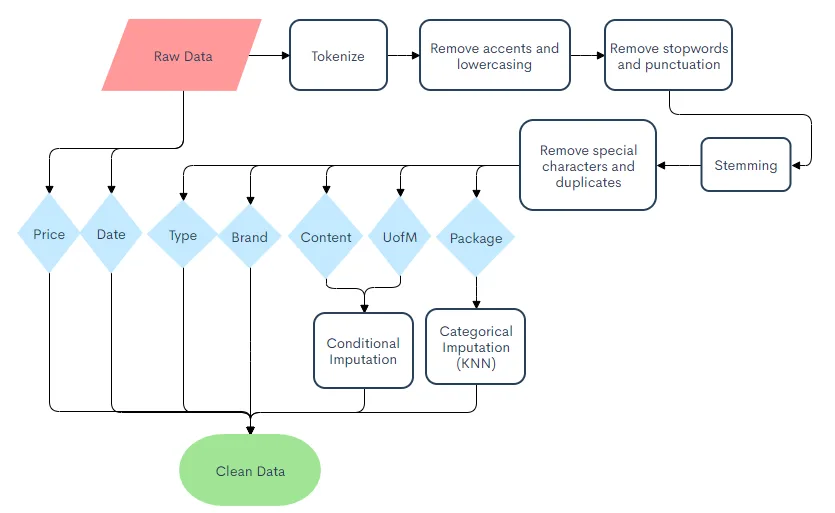
Flowchart for data cleaning
In addition to the natural language techniques described in the diagram, they simplified the category dictionary manually, with which they avoided considering derived words or those that do not provide valuable information.
They also performed the imputation of missing values by applying a conditional technique with which the inference of imputed values is carried out using a logical sequence. For example, if we know that the common unit of measurement for milk is L or ml, the categorization follows a logical sequence to impute this value.
Applying natural language techniques plus the imputation described, they generated the following enriched data set.
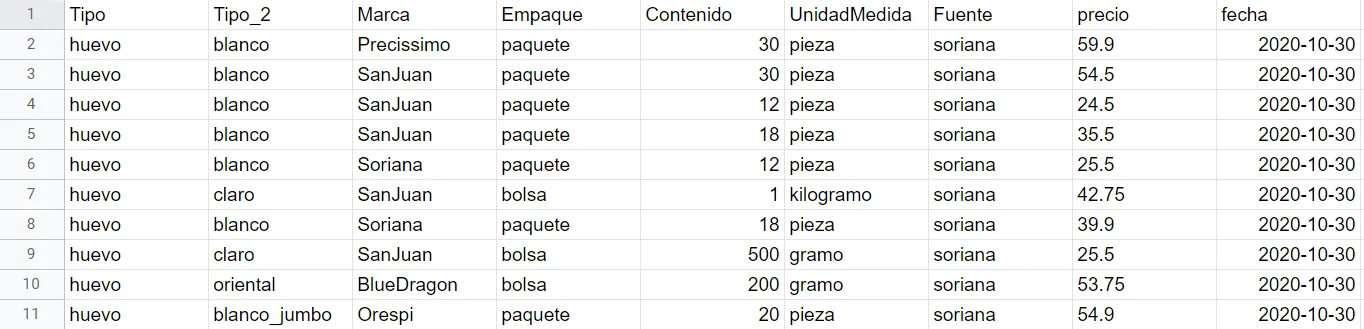
Cleaned data set
The main challenges of the methodology used are set out below: (1) The manual creation of word dictionaries to be able to categorize them in the corresponding columns of interest. For example, the categorization of the type of food being described. (2) Process words never seen before by the dictionary. Anglicisms play an important role in the Hispanic lexicon, so an important challenge is the translation of the Anglicisms or, failing that, including them in the category dictionary.
Prices as time series
With a refined price data set, it seems that we would have the necessary elements to make more detailed analyzes such as price forecasts. But because price dynamics present significant changes in time frames of a week, at the time of writing this article we only had a few points collected weekly.
According to an article written by Box and Jenkins in 1976, at least 50 observations are recommended to make reliable forecasts and in more current works, such as that of Otero and Trujillo in 1998, good results have been obtained with 30 observations.
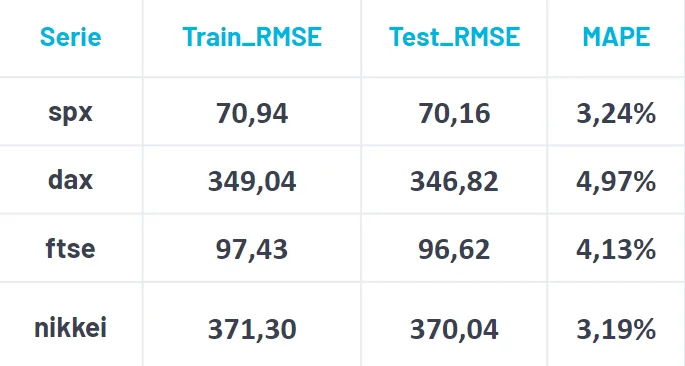
Despite this adverse situation, two members of the team, John and Mario, wanted to start the time series analysis with an independent data set that did have that amount of observations, to simulate the forecast of future prices with the criterion that the modeling is automatic, That is, the model with the best MAPE (Mean Absolute Percentage Error) is selected. We analyze the following algorithms:(1) Auto Arima, (2) Triple Exponential Smoothing, (3) Facebook Prophet.
Below, we show a test using four stock market indices (SPX, DAX, FTSE and Nikkei), with the best-performing algorithm in that comparison. These data are independent of the supermarket price data.
BasketTracker.AI: Price Monitor
Finally, we crowned the effort described above with a visualization tool that allowed us to take advantage of our refined and enriched Dataset, to help make pricing decisions.
Our colleague Juan Manuel and our mentor David took the lead in the visual communication, as well as the deployment of the BasketTracker.AI monitor in a web application.
Below we present the elements that we choose to communicate visually: (1) Time series and prediction, (2) Product inflation calculation, (3) Comparison between brands and stores, (4) Top 3 items with the highest/lowest cost and some KPIs
We considered that we should consolidate all of the above into a single point. It should be something easily accessible that brings together all the elements that we defined to develop at the beginning and presents them in a simple way to the end user. For this reason, we decided that the best way to achieve this would be with a general results dashboard.
Two interactive dashboards were created, the first using Tableau software and the second using Amazon's QuickSight tool.
Below we show some screenshots of the dashboards:
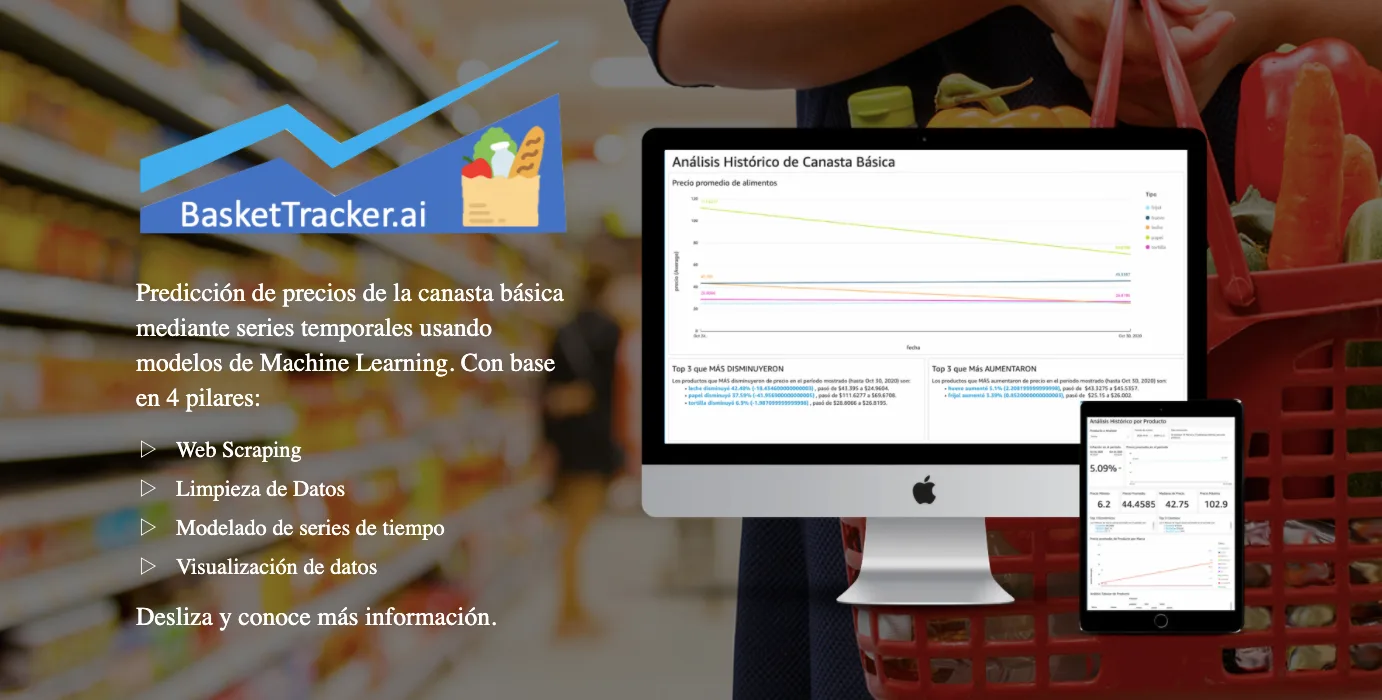
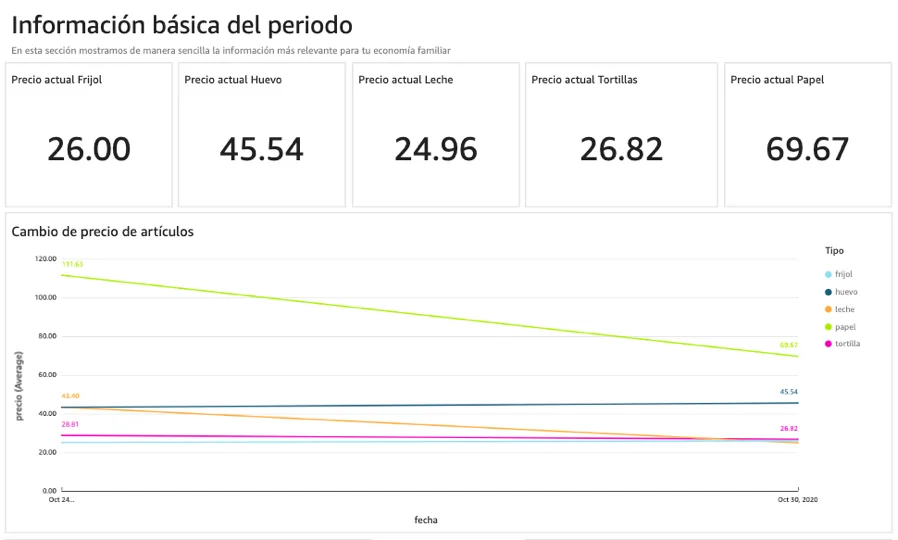
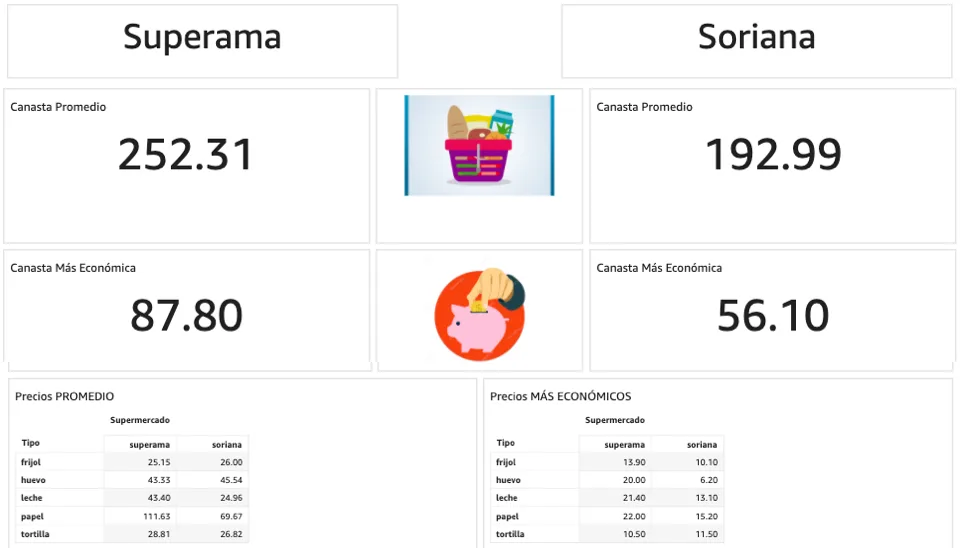
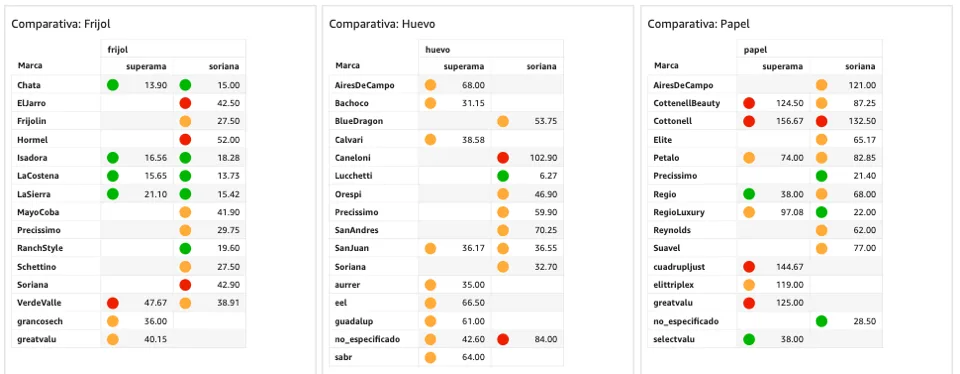
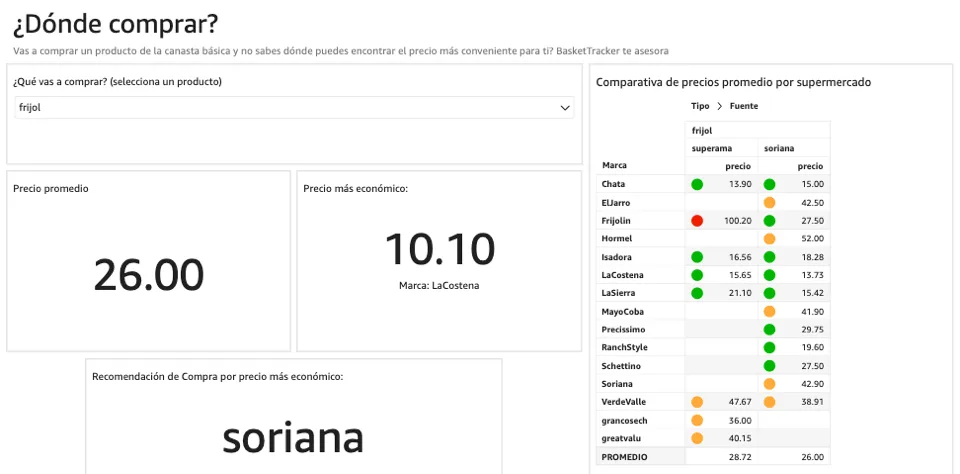
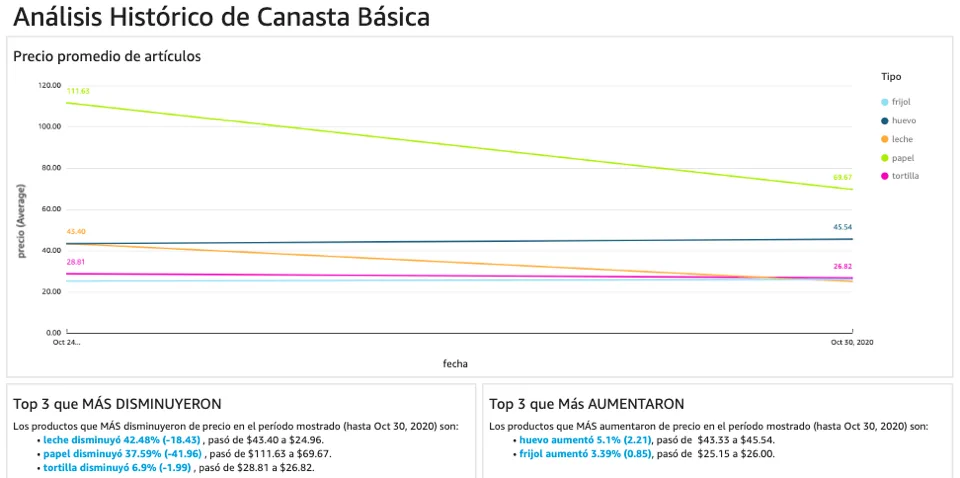
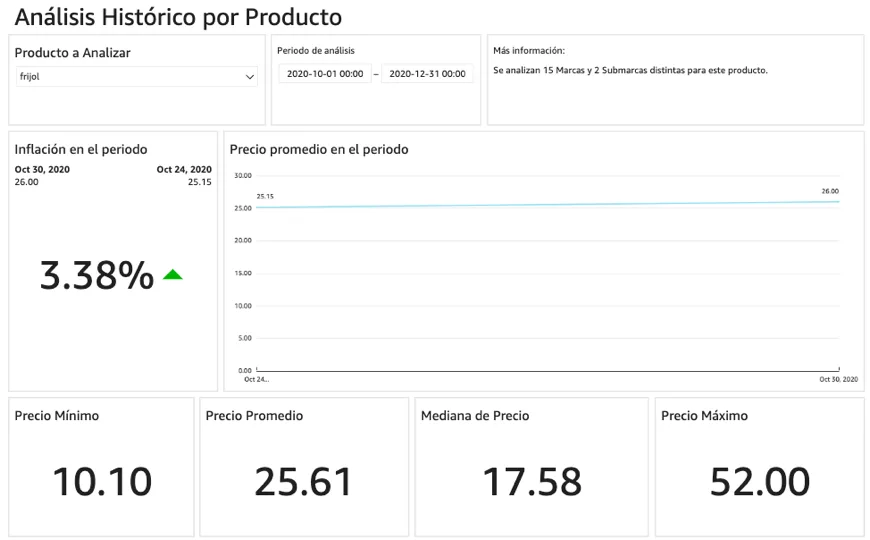
QuickSight Dashboard
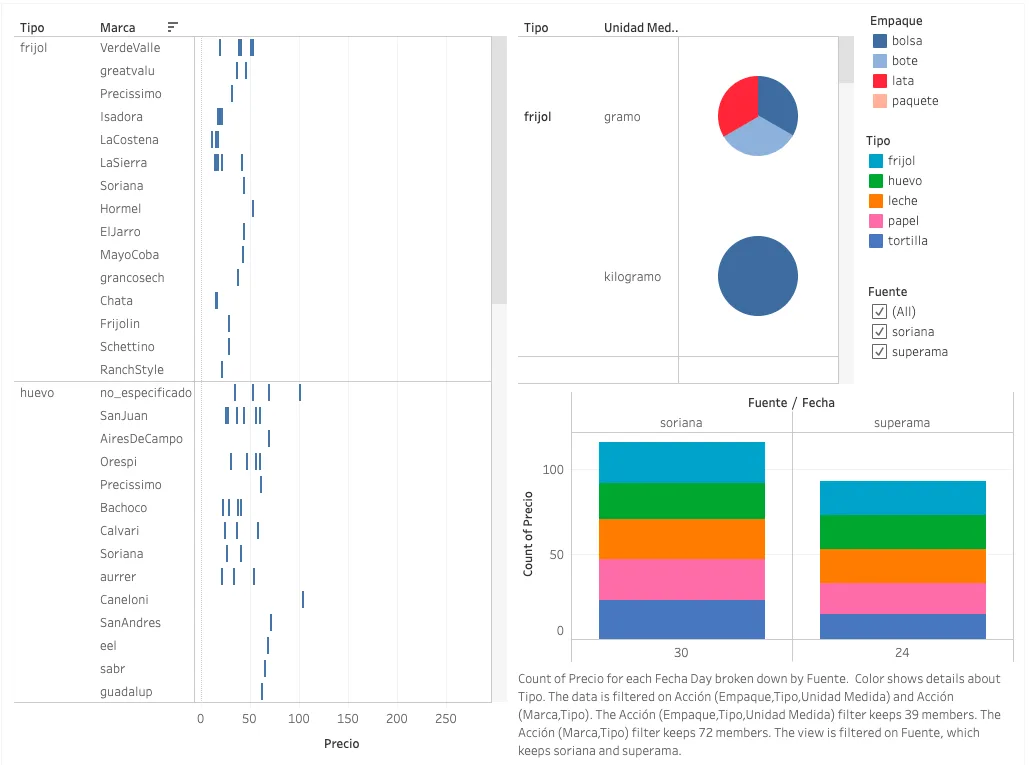
Tableau Dashboard
Conclusions
In this article we share our experience developing a price monitor as a team project in the first edition of Saturdays AI Latin America. We are satisfied to have coupled different disciplines within Artificial Intelligence, such as NLP and time series forecasting, with aspects of data integration and web development and Business Intelligence to build a proof of concept to monitor prices.
Of course there are still many improvements to be made and we will probably develop them in future versions of our work.
We hope that this article motivates you to strengthen your skills in Artificial Intelligence, putting your knowledge into practice to learn by doing. Until next time.
Bibliography
Box, G. E. P. and G. M. Jenkins. 1976. Time Series Analysis: Forecasting and Control. Holden-Day, San Francisco.
Otero, J; Trujillo, F. 1998: “Forecasting Tourism Demand in the Short Term: The Case of Andalusian Hotel Establishments”, 4th International Forum on Tourism Statistics. Copenhague
Members
- Gabriela Vega
- Gustavo Leyva
- Juan Esteban Zurita
- Juan Manuel Ahumada
- John Jacho
- Ramón Díaz
- Mario Fonseca
Project presentation: DemoDay
Repository
In the following repository you will find the code used to develop this application: https://github.com/SaturdaysAI/Projects/tree/master/LATAM_remote/equipo_dorado
More artificial intelligence!
Saturdays.AI makes AI more accessible through shared learning and projects with a social purpose. Our motto is AI4ALL IS AI4GOOD.
A story from the Saturdays.AI community. Originally published on March 16, 2022.
← More community stories