Machine Learning applied to soil compaction.
In this article, we will use Machine Learning techniques to optimize soil compaction. Soil is a material composed of a solid, liquid and gaseous part, which was formed over hundreds of millions of years...
A learning project shared by the community. The article documents its team, methods and results; it does not establish that the prototype is ready for real-world use.

In this article, we will use Machine Learning techniques to optimize soil compaction.
Soil contains solid, liquid and gaseous components and forms through weathering and sedimentation. Compaction applies a load to reduce air-filled voids and increase soil density.
The compaction curve consists of a curve that is constructed after marking the pairs of dry-density and moisture values of the sample. With a minimum of 5 points, a curve is drawn by hand that can correlate all these points and the maximum dry density and the optimum moisture content at which this soil can be compacted are obtained.
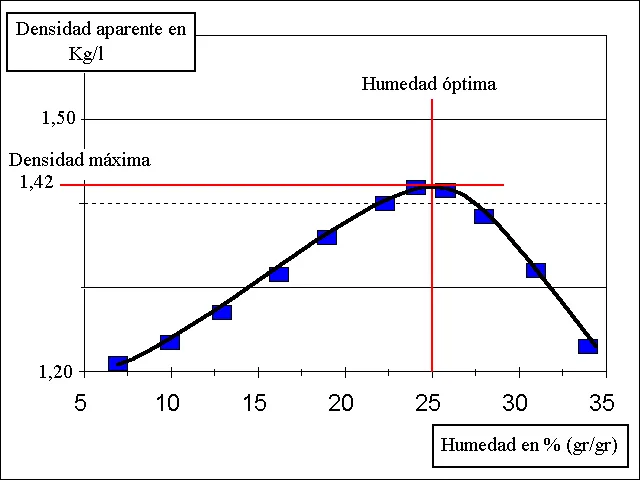
Soil classification and compaction properties are determined using different tests. This project seeks a statistical relationship that can estimate compaction results from soil characteristics.
Problem description
For each kilometer of road, 5 test pits are required, of which two tests must be submitted:
- Soil classification
- Compaction
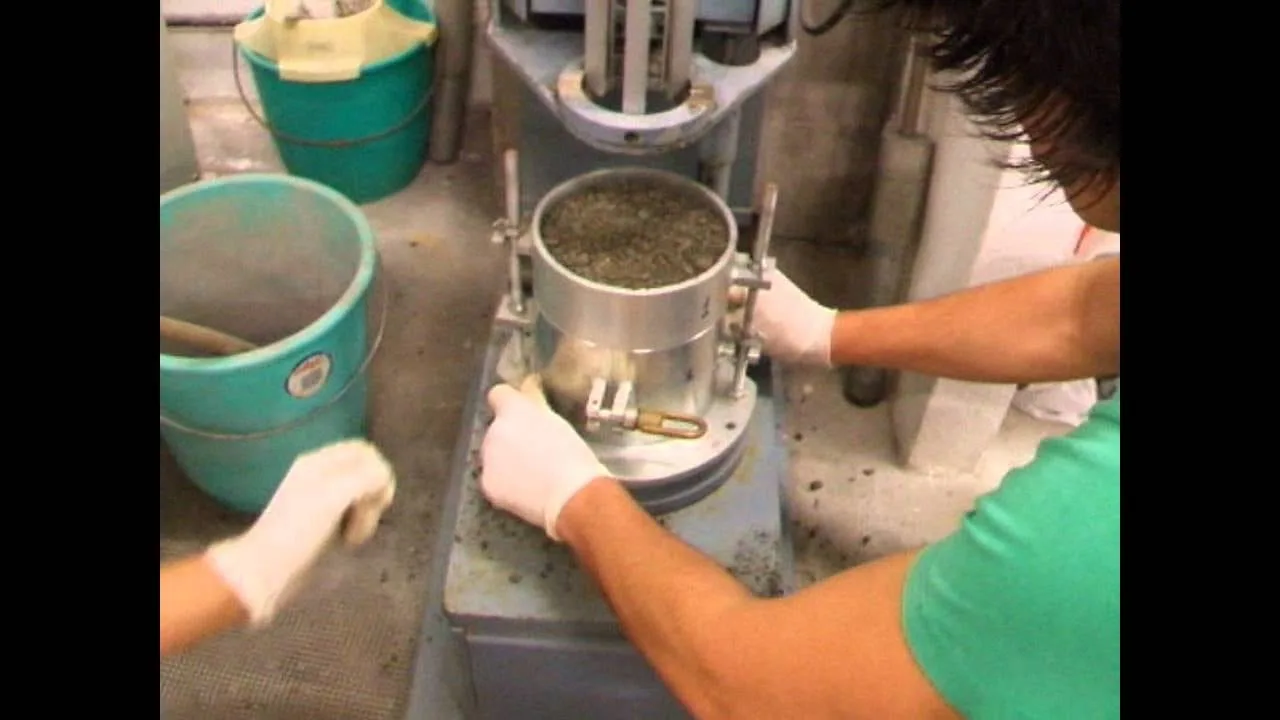
In practice, due to the economic resources and logistics involved, only 5 classification tests and 2 compaction tests are carried out and the results are interpolated.
Objective
Determine using Machine Learning techniques a correlation between soil classification and soil compaction, referring to the maximum dry density and optimum moisture content value, to calculate the moisture content at which a certain section of road will be compacted.
Model selection
Because the result is known and the problem is numerical, the models used were:
- Linear regression
- Multiple linear regression
- Polynomial regression
Techniques implemented
Dimension reduction
We removed the columns that did not provide relevant information for this analysis: ‘Pozo’, ‘Lado’, ‘Prf o (m)’, ‘Prf f (m)’, ‘% Hum’, ‘ST >3’, ‘3’, ‘AASTHO’, ‘#’, ‘SUCS’, ‘100%’, ‘97%’, ‘95%’, ‘100%.1’, ‘97%.1’, ‘95%.1’.
Missing values
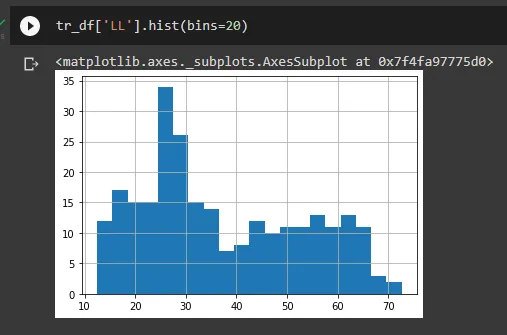
The LL column had 30 missing values. After examining its distribution with a histogram, we chose to impute them using the median, 32.2.
Graphics
All the necessary graphs were made to understand and interpret the problem.
Linear relationship (with sklearn)
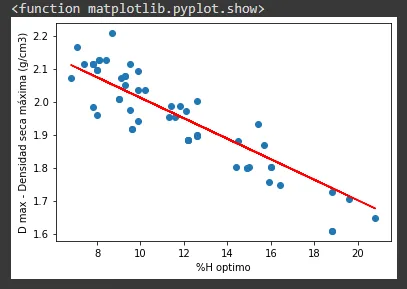
2nd degree polynomial relationship (with numpy)
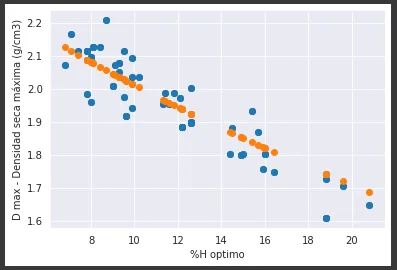
3rd degree polynomial relationship (with numpy)
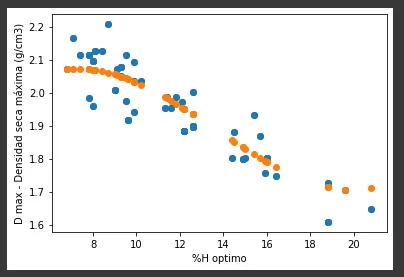
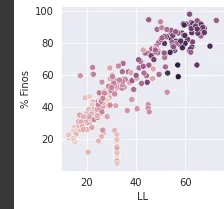
Multiple linear relationship (with sklearn)
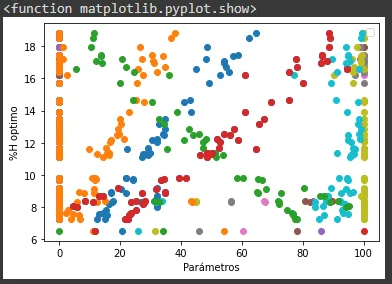
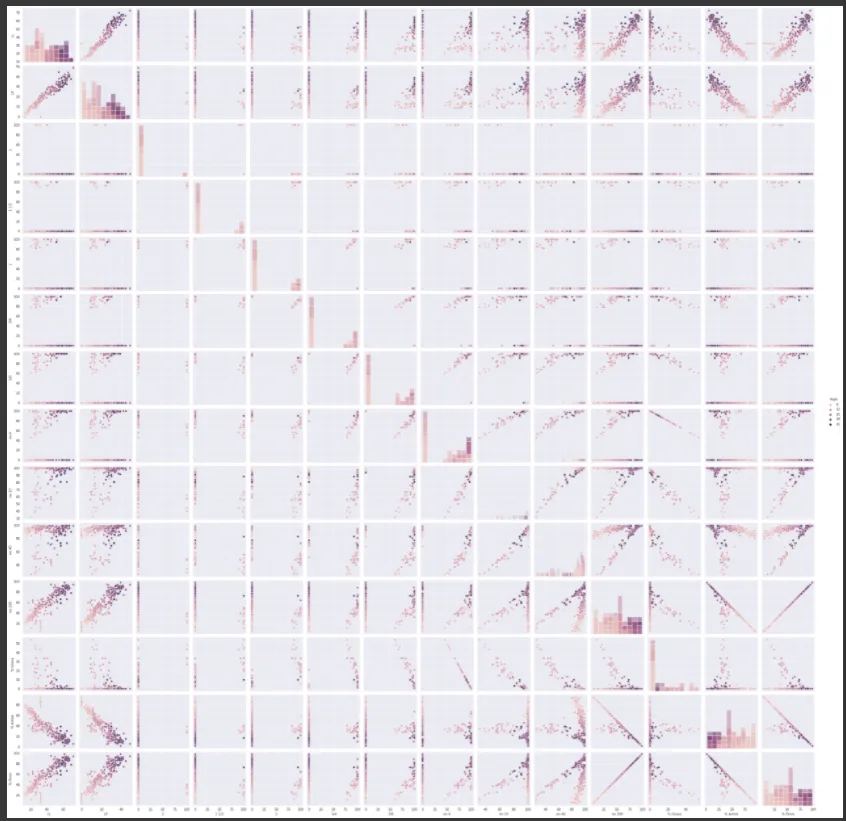
Multiple linear relationship (with sns) where the 14 parameters are related to each other and their relationship with the optimum moisture content.
Model evaluation
D max vs H opt
Linear regression:

2nd degree polynomial regression:

3rd degree polynomial regression:

Feature vs H opt
Linear regression:

Analysis of results
D max vs H opt
It can be seen that it is the polynomial regression that has a correlation coefficient closest to 1 and in the graph the one that best fits, which is why it will be the regression adopted
Feature vs H opt
A correlation coefficient value close to 1 can be observed and in the sns graphs the vast majority are linear relationships, so the multiple linear model achieved is accepted.
Conclusion
A correlation was determined between soil classification and soil compaction, to calculate the moisture content at which a certain stretch of road will be compacted:

H opt = 0.117*(LL) + 0.0212*(LP) — 0.007*(2) + 0.010*(1 ½) — 0.004*(1) — 0.001*(¾) + 0.017*(⅜) — 0.001*(no 4) — 0.052*(no 10) +
+ 0.054*(no 40) + 0.036*(no 200) — 0.043*(% Grava) + 0.007*(% Arena) + 0.036*(% Finos) + 3.779

D max = 4.110*10^(-4)*(H opt)² — 4.256*10^(-2)*(H opt) + 2.394
Written by
Mauricio Ramirez Salamanca
Follow

More artificial intelligence!
Saturdays.AI makes AI more accessible through shared learning and projects with a social purpose. Our motto is AI4ALL IS AI4GOOD.
A story from the Saturdays.AI community. Originally published on Nov 12, 2021.
← More community stories