Artificial intelligence for detecting waste accumulation
Latam online. Second Edition. 2021 Currently, municipal waste worldwide could increase by 70% in the next 30 years, thus causing piles of garbage to accumulate around the world (World Bank,…
A learning project shared by the community. The article documents its team, methods and results; it does not establish that the prototype is ready for real-world use.
This archive includes automatic translations. Audio, video and text inside images remain in their original language.
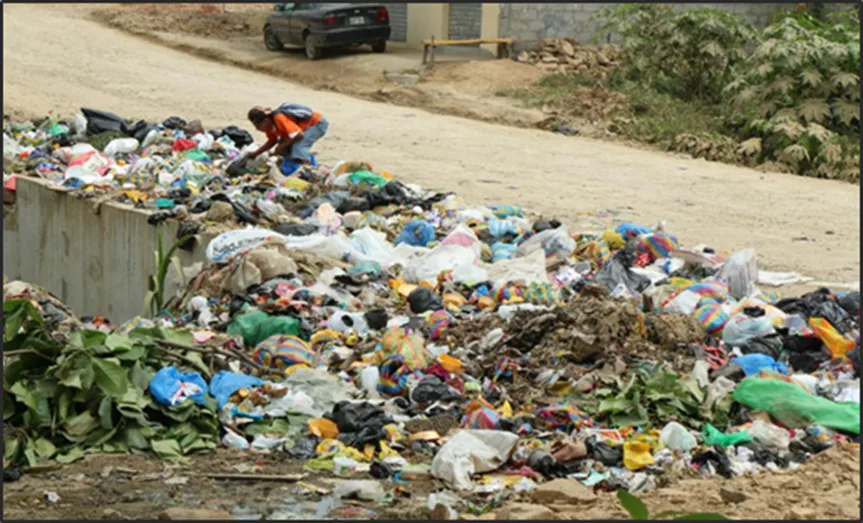
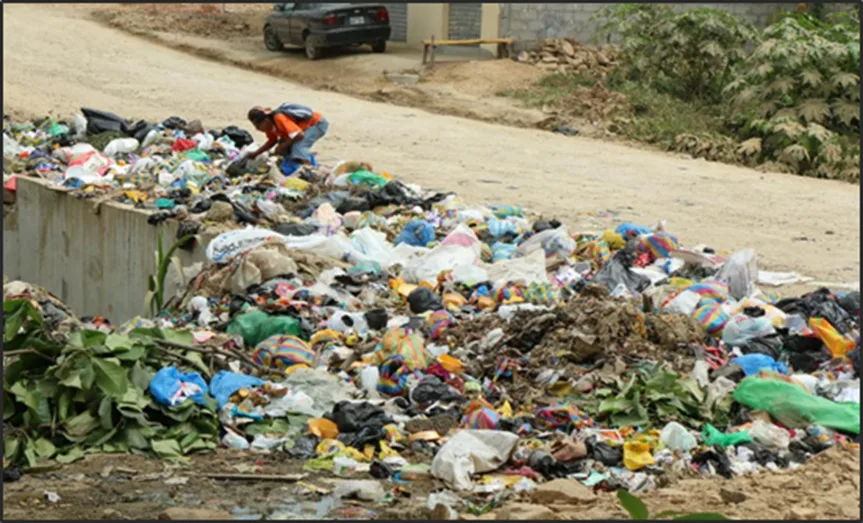
Figure 1.- Accumulation of garbage in the streets.

Latam online. Second Edition. 2021
Currently, municipal waste worldwide could increase by 70% in the next 30 years, thus causing piles of garbage to accumulate around the world (World Bank, 2019). This is why, if urgent measures are not taken, a future is expected where living with garbage is normal for society.
Due to the consequences of uncontrolled and unplanned garbage accumulations, different strategies must be taken to cushion their occurrences in different parts of the world.
Problem description
The problem of the accumulation of garbage not only lies in the bad smell that is perceived, but also in the image of unhealthiness, disorder and even insecurity that the garbage scattered in the streets generates. In the streets you can find everything from cardboard and diapers to fruit peels, plastic and old sheets. All this at the foot of the rainwater channel, at whose bases it is also common to see all types of debris floating.
According to the Ministry of the Environment, in Ecuador the most critical is the Coast, where only 10% of the municipalities have a sanitary landfill, manual or mechanized; in the Sierra region they are 25%, and in the East, 24%. Therefore, the garbage figures within the country increase daily as seen in Figure 2.
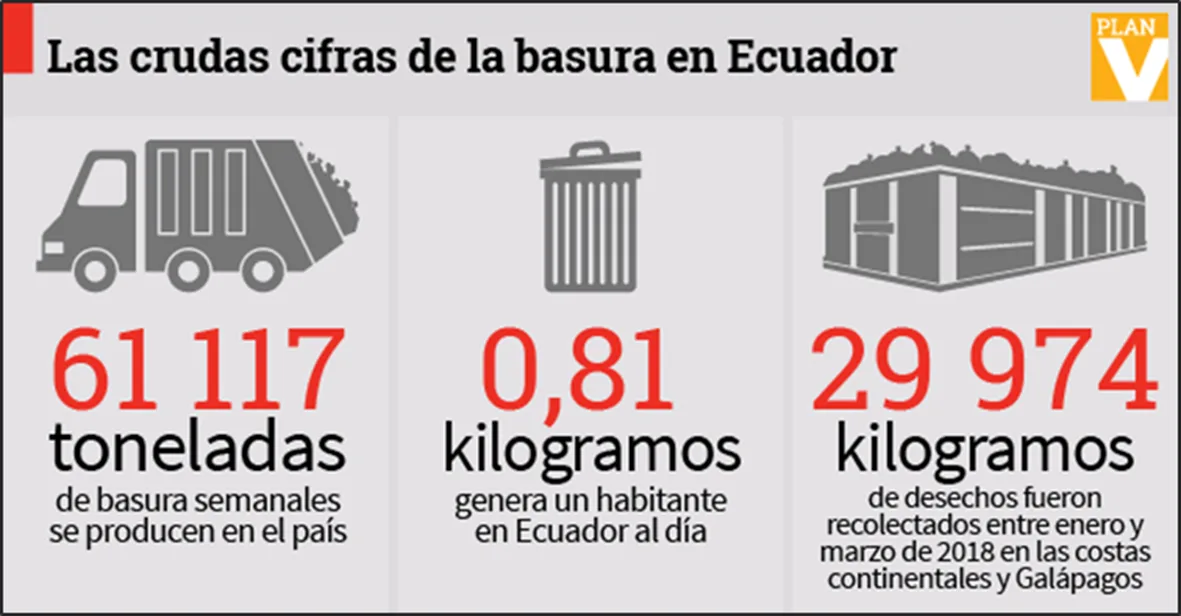
Figure 2.- Garbage figures in Ecuador.
Figure 2.1 shows some of the consequences of the accumulation of garbage, such as: damage to public infrastructure, increase in diseases and pests, flooding in the streets, obstruction in sewers and among others.
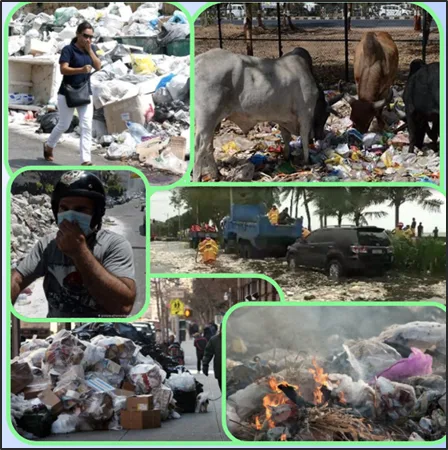
Figure 2.1.- Consequences of garbage accumulation.
In the city of Guayaquil, penalties for disposing of non-hazardous solid waste outside the established frequency and schedule and accumulating garbage in flower beds and sidewalks; they range from $80 to $500 .
How is our project born?

Clean City was based on the following question : How to identify in a timely manner the accumulation of uncontrolled garbage in the city of Guayaquil to minimize the impact on society? For this reason we created an application that allows us to contribute to garbage collection. Involving citizens in improving the cleanliness of the city and getting some companies interested in our technological tool based on Artificial Intelligence.
Project members
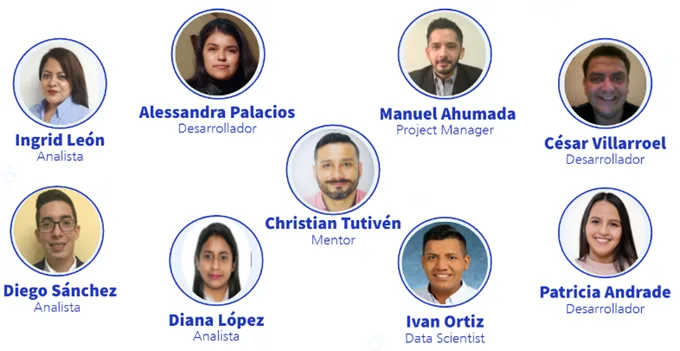
Figure 3.- Purple team — SaturdayAI –EPIC 2021
Team experience
Manuel Ahumada "It was a practical learning experience: focused on doing to acquire the topics and concepts presented. That reinforces knowledge."
Patricia Andrade "My experience was very enriching due to all the new knowledge I learned. In addition, I really liked sharing ideas with colleagues from different fields to solve a practical problem."
Cesar Villarroel "It was a practical learning experience: focused on doing to achieve the acquisition of the topics and concepts presented. That reinforces knowledge."
Ingrid Leon "The experience obtained in this modality is good. Being able to share knowledge, challenges and risks makes us more professional. I am left with a phrase "There are two basic options: accept the conditions as they exist or accept the responsibility of modifying them", then we can always improve."
General objective
In the following figure 4, you can see the main idea of the project.
Develop an application based on Artificial Intelligence that allows identifying agglomerations of garbage on public roads in urban areas.
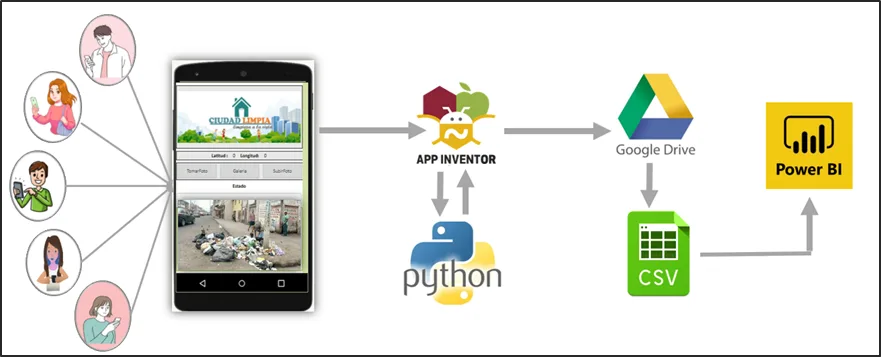
Figure 4.- Project value proposition.
Solution approach
It is projected that through the collaboration of citizens, awareness will be created where they are part of the cleanliness and care of the city. How are they going to do it? Easy, through the app “Clean City” , where they can take a photo to identify and report the accumulation of garbage in a certain sector. Additionally, the application records the date, time and location of the problem. This application will be based on Artificial Intelligence that will allow identifying agglomerations of garbage on public roads in urban areas and promoting an immediate action plan for health authorities.
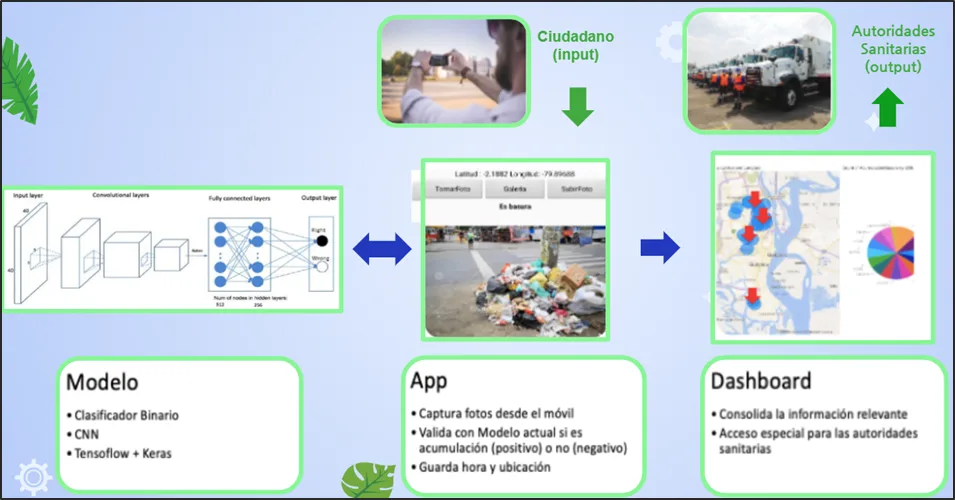
Figure 5.- General Diagram of the solution.
Data set
The data set that was formed was based on downloading images individually from the Internet, videos transformed into frames. In addition, the Kaggle and Google Street view platform was released where a large number of datasets of garbage agglomeration images could be obtained.

Figure 6.- Means to obtain the data set
Model selection
For the selection of the models, the following considerations were obtained:
- Easy implementation.
- Model performance.
- Calculation limitation.
These considerations are due to the resources available to achieve the general objective. The models to be developed are:
- CCN Custom.
- VGG-16.
- homeV3.
Techniques implemented
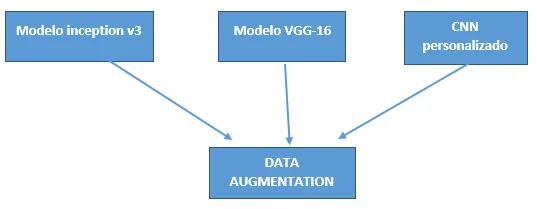
The main technique used to compensate for the limited data set size due to the Google image search limitation was “data augmentation” performed by the “ImageDataGenerator” keras library.
Data augmentation
Data augmentation is the artificial generation of data through perturbations to the original data. This allows us to increase both the size and diversity of our training data set. In computer vision, this technique became a regularization standard, and also to improve performance and combat overfitting in CNNs.
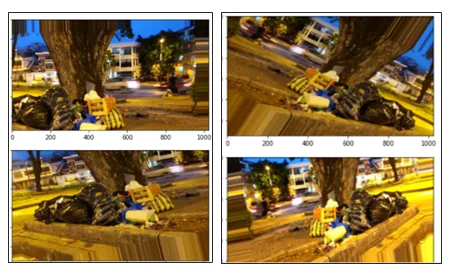
Figure 7.- Example of data augmentation.
In the three selected models, the data augmentation technique was considered with the objective of normalizing or re-scaling the pixels in a range from 0 to 1. In addition to modifying the images of the train set with the objective that there is a distinction in each of the selected images in terms of width, length, amplitude, rotation and scaling. Below is the code where the training images are transformed with the selected parameters:
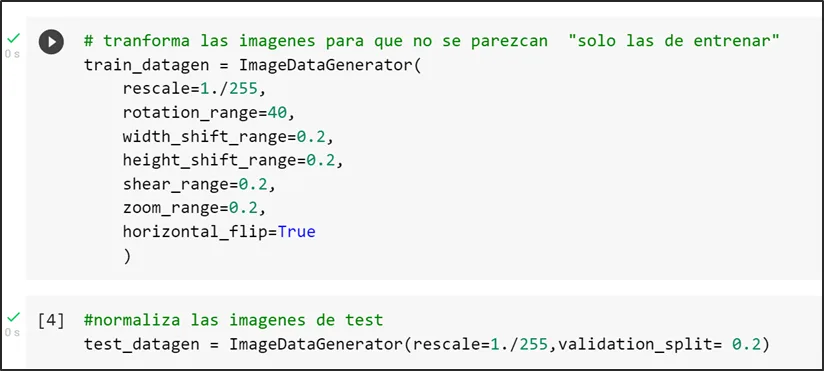
Figure 8.- Image training code.
Custom CNN
In the personalized CNN model, regulation techniques, callbacks and finally keras tuner were applied.
Keras Tuner
Keras Tuner is a very easy-to-use library that greatly simplifies the complexity process of applying hyper-parameter optimization to deep neural networks built using Keras, offering us a wide degree of versatility to optimize both the structure of our network and the configuration of the parameters of some of the algorithms involved in the training process.
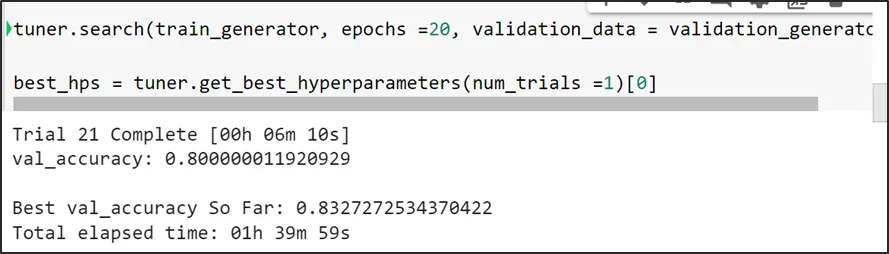
Figure 9.- the value of the test and accuracy can be verified
While analyzing each trial, Keras Tuner verifies the best val accuracy value, inferring that it is the best configuration of the architecture, and proceeds to save the best configuration of the model architecture (number of layers) with which it tends to achieve the best metric.
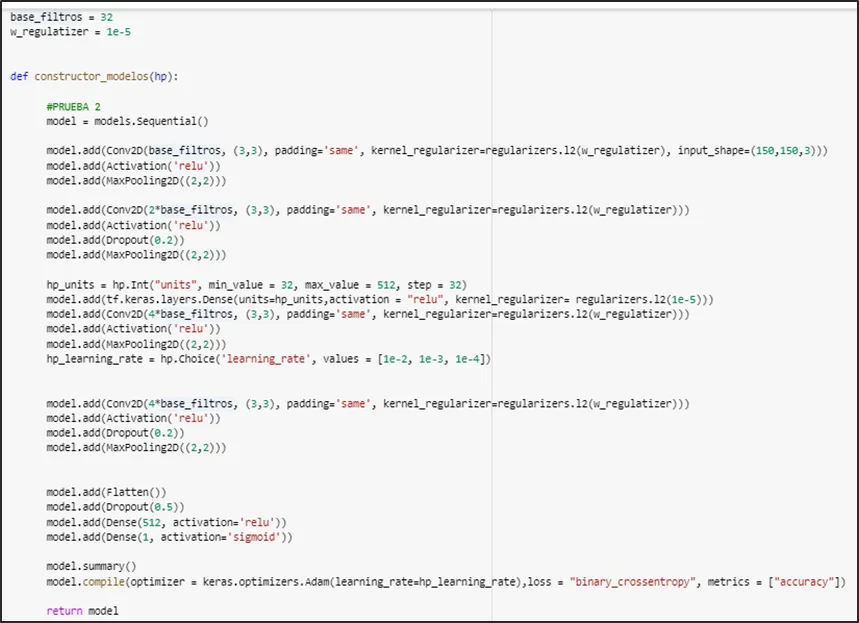
Figure 10.- cnn model code
Custom cnn model architecture features regularizers, convolution, keras tuner
InceptionV3
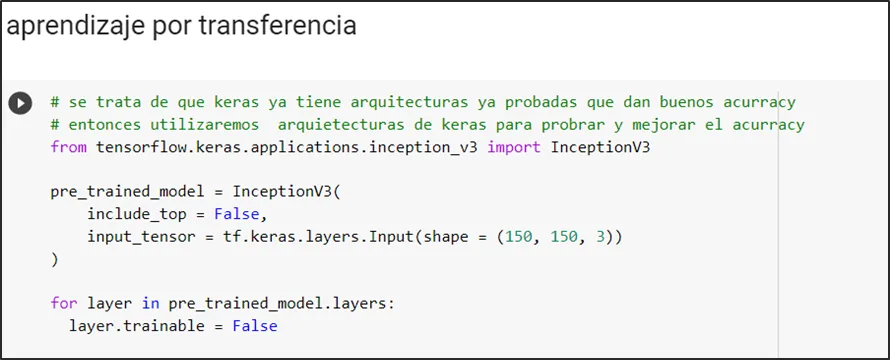
Figure 11.- shows the pre-training
The inceptionv3 pre-trained model is defined, validating the size of the input images with which it is trained:
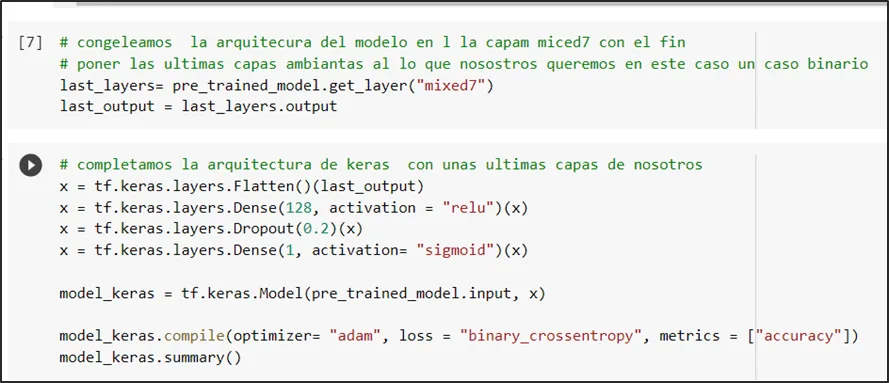
Figure 12.- use of the mixed7 architecture
The architecture is frozen in the “mixed7” layer and then altered by adding layers based on the prediction of our model, which is a binary classification by which the last layer has sigmoidal activation which offers us the probability of whether a case is positive or negative.
VGG-16
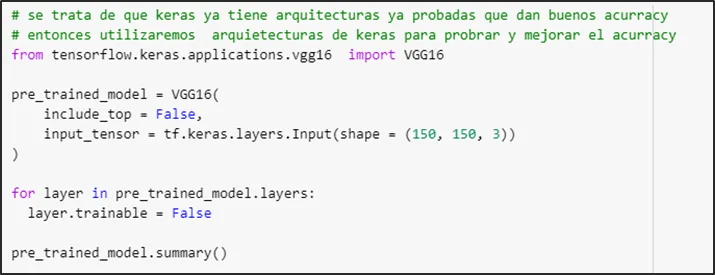
Figure 13.- Additional features with VGG16
The pre-trained vgg16 model is defined and validates the size of the input images with which it is trained
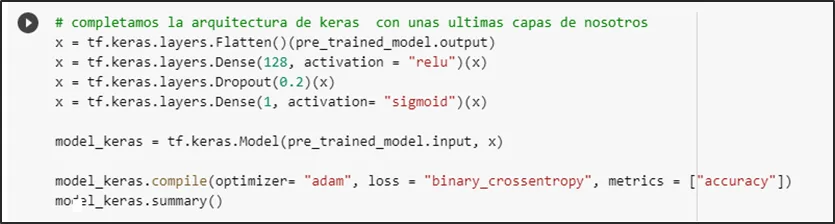
Figure 14.- increase in layers (binary classification)
We proceed to increase the layers based on the prediction of our model, which is a binary classification, so the last layer has sigmoidal activation which offers us as a result the probability that if a case is positive or negative
Analysis of results
Custom CNN
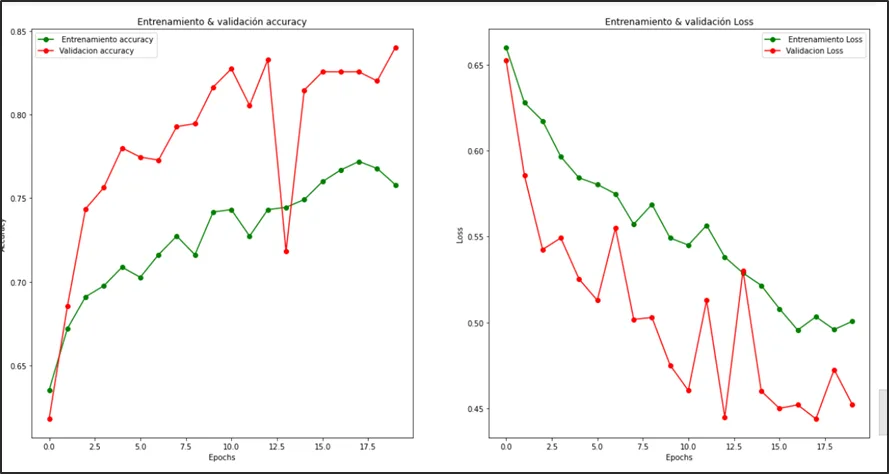
Figure 15.- graph of the personalized cnn model with 20 epochs
In the evaluation of the model, it was trained with 20 epochs. I know it can be verified that it does not manage to converge in its entirety. Achieves an accuracy of the test set evaluation of 78%

InceptionV3
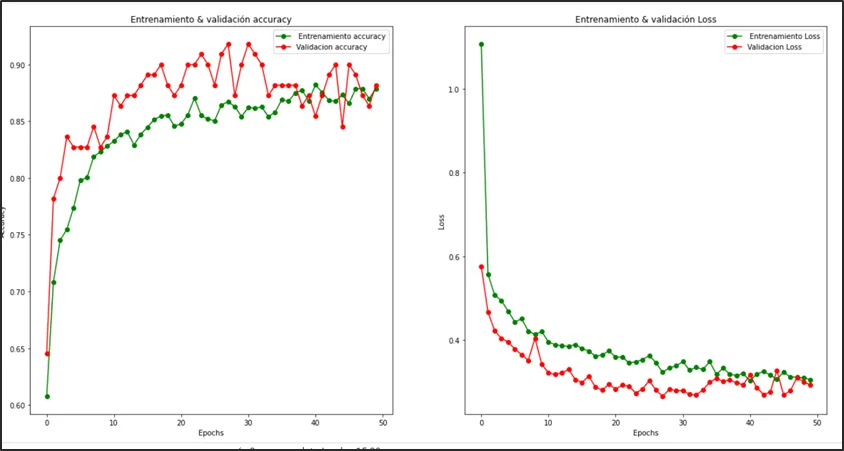
Figure 16.- graph of the pre-trained model with 50 epochs
In the evaluation of the model which was trained with 50 epochs, it can be analyzed that it manages to converge completely from epoch 28 onwards, with an evaluation precision of the test set of 85%.

VGG-16
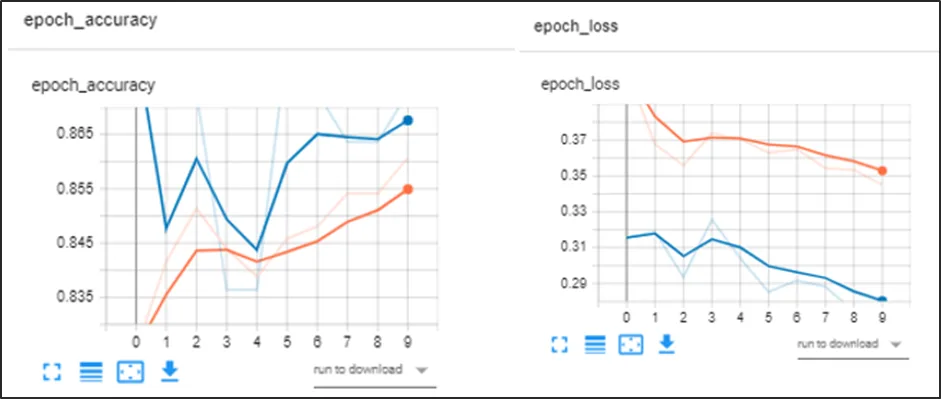
Figure 17.- graph of the pre-trained model with 10 epochs
In the evaluation of the model which was trained with 10 epochs, it can be analyzed that it manages to converge, with a precision of the evaluation of the test set of 84%.

Below we show the model predictions:
InceptionV3
Test folder prediction
The prediction probabilities of the test set are obtained
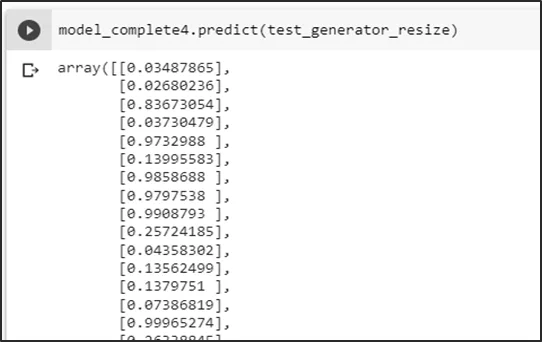
First test without garbage
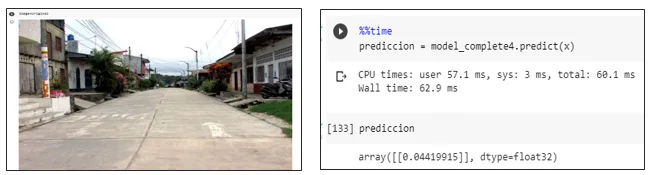
Testing the model predicting an image without garbage resulting in a probability less than a threshold of 0.5 is identified as a no crowding.
Second test with garbage
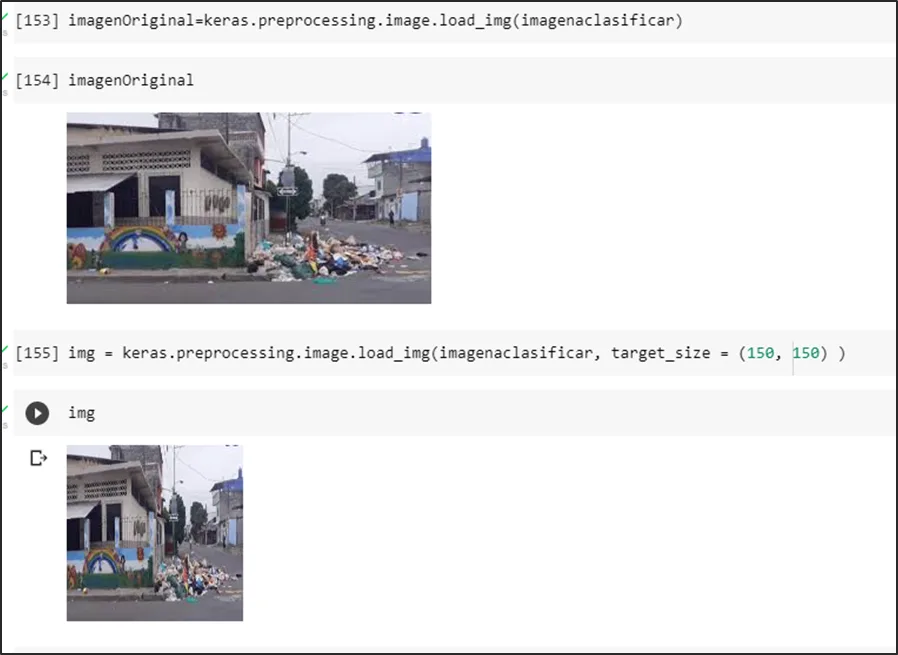
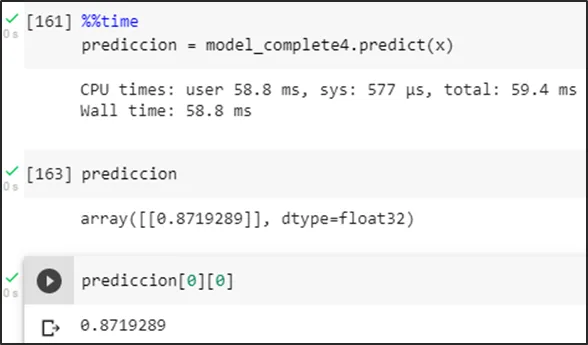
Testing the model predicting an image with garbage, generating a probability greater than a threshold of 0.5, identifies it as an agglomeration.
Third test with image and many colors
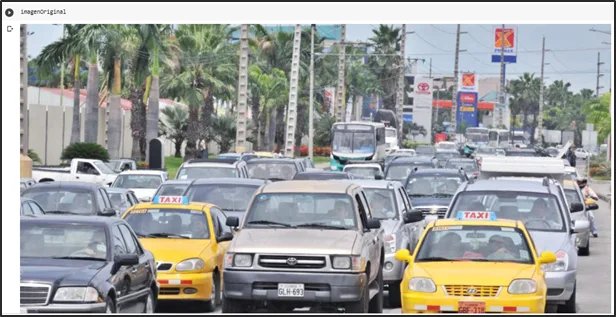
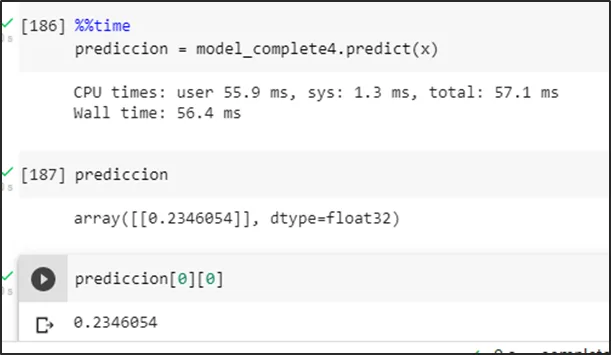
Test the model predicting a false positive image, trying to break the prediction, consequently obtaining a probability less than a threshold of 0.5, it is identified as a no crowding
VGG-16
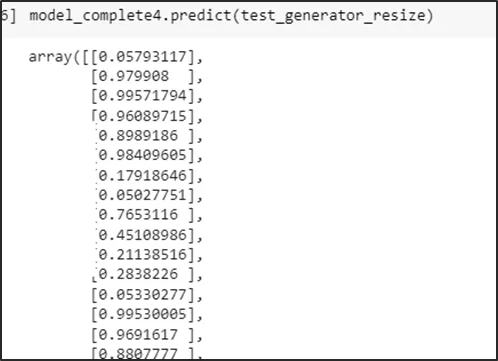
Test folder prediction
The prediction probabilities of the test set are obtained
First test without garbage
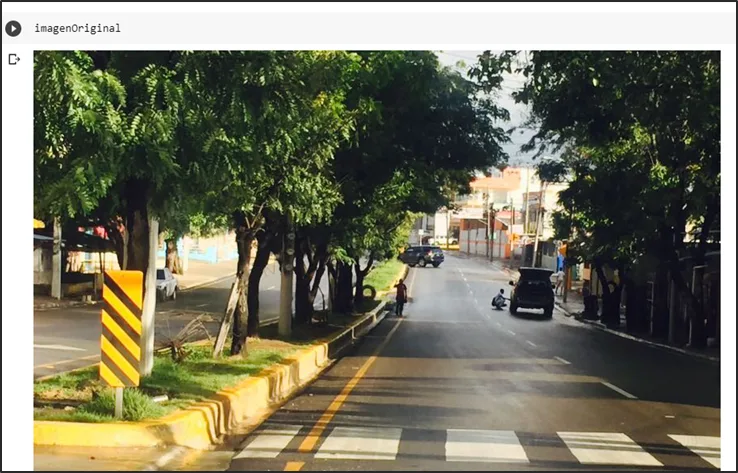
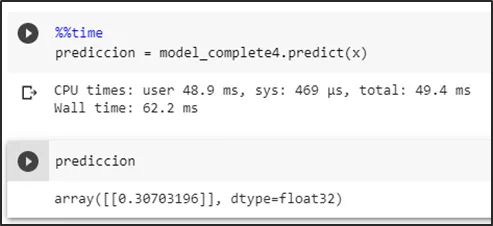
Testing the model predicting an image without garbage resulting in a probability less than a threshold of 0.5 is identified as a no crowding
Second test with garbage
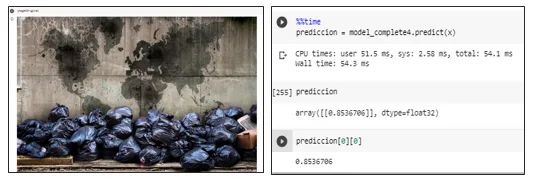
Testing the model predicting an image with garbage showing a probability greater than a threshold of 0.5, it is identified as a agglomeration
Third test with image of different colors
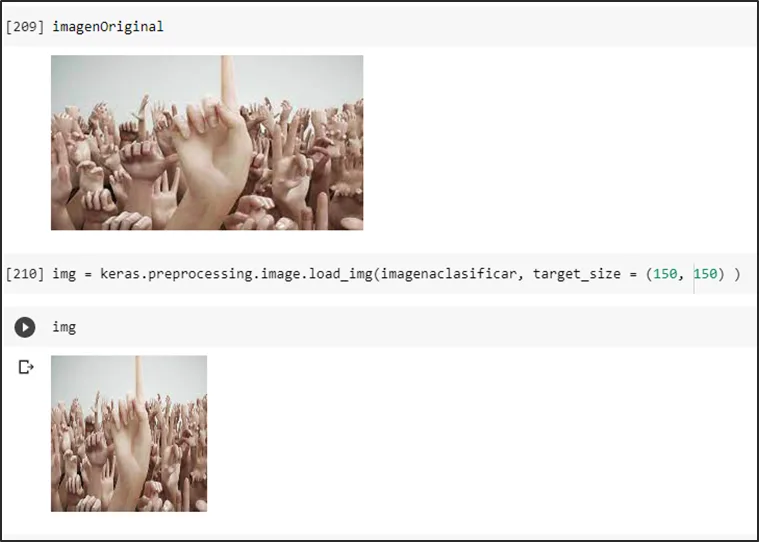
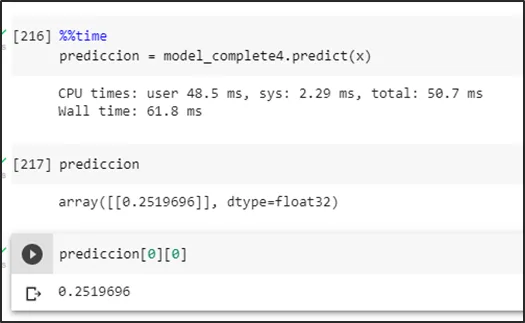
Test the model predicting a false positive image, trying to break the prediction, consequently obtaining a probability less than a threshold of 0.5, it is identified as a no crowding
Metrics of the chosen model: InceptionV3
confusion matrix
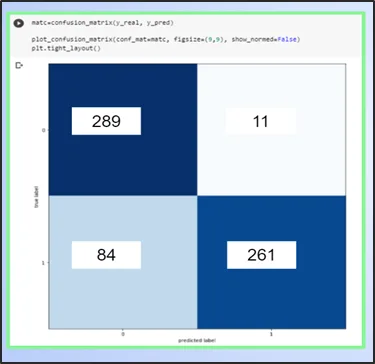
In the confusion matrix we can deduce that it is predicting acceptably, but it can improve the prediction of false negatives. This can be solved by increasing images of positives so that the model training improves the positives.
Metrics
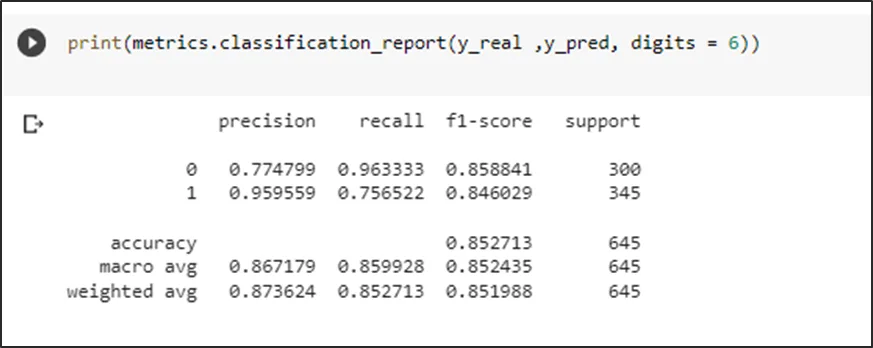
The metrics obtained are acceptable with an f1 score of 85% prediction for negative cases and 84% for positive cases, this would confirm the theory of increasing the data in positive cases.
Mobile application (“Clean City”)
Why do we choose App Inventor?
Currently, there are many ways to develop applications on mobile devices that fulfill a specific function and are compatible with different operating systems.
This is why the environment of App Inventor . Through this platform you can program in JavaScript easily and simply because it uses block programming that allows greater understanding and use by the user.
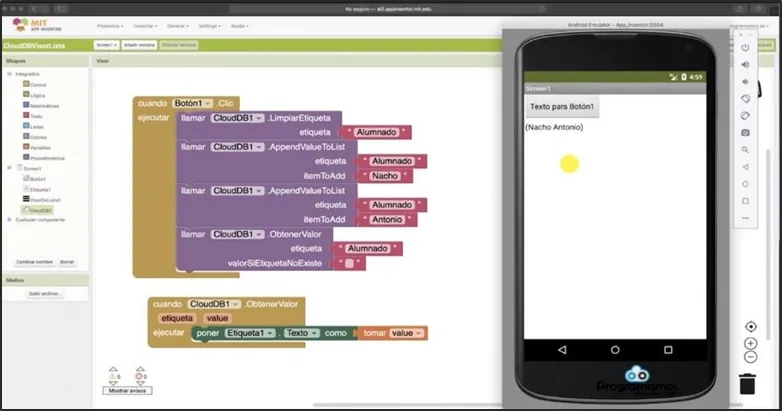
Figure 18.- App Inventor environment
Architecture
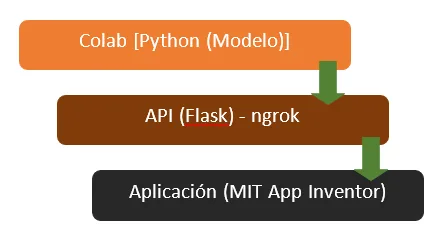
With respect to the architecture of our “Clean City” application, we have the following steps to follow, as seen in the following illustration ():
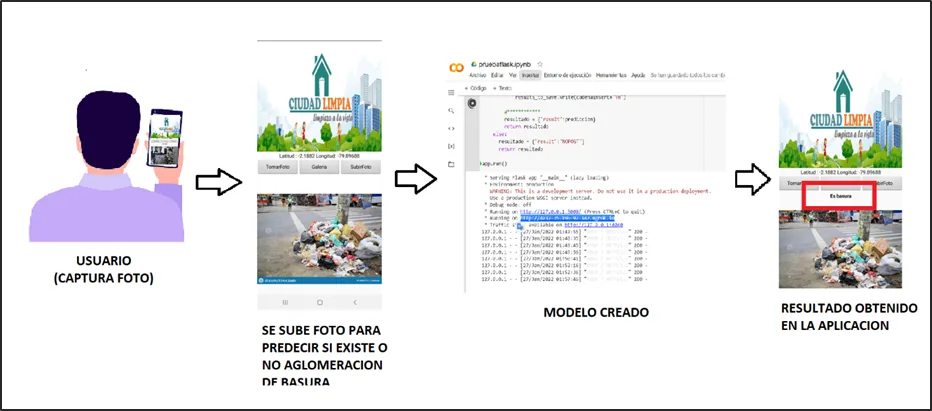
Figure 19.- Application architecture
Connecting App Inventor with Google Colab
The connection of the “Clean City” application with the model created through Google Colab is done through the creation of a local server exposed to the Internet for access to the mobile application using ngrok. By making a POST request from APP Inventor, the image encoded in bit64 is sent to the server which executes the model and returns the result obtained classified as garbage agglomeration or non-agglomeration.
Functionality of the “Clean City” application
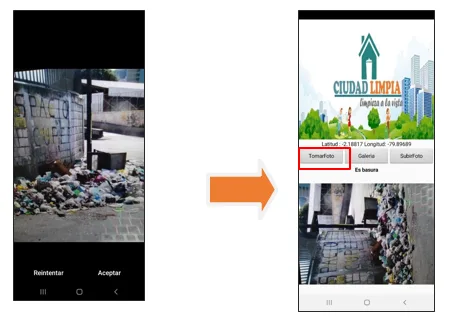
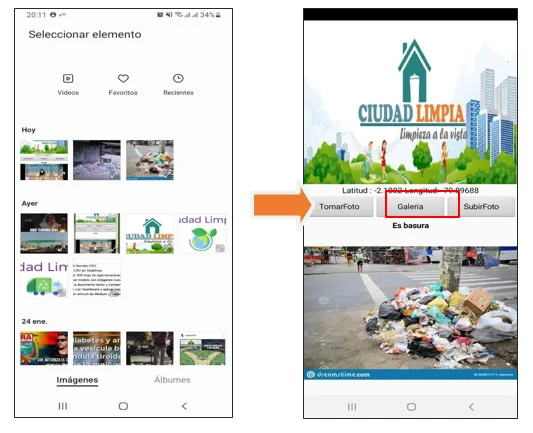
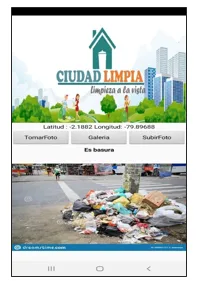
With respect to the environment and management of the “Clean City” App, three buttons are considered within the interface with different functions when processing a photograph:
- User “take photo”: In this case, the user uses their device's camera to capture the image of the agglomeration of garbage in their area.
- User selects “gallery photo”: In this case, the user selects a photo that he has recorded about the agglomeration of garbage in his sector that he finds within his cell phone image gallery.
- User “upload photo”: In this case, the user uploads the photo of the garbage agglomeration in his sector so that it is registered and notified to the relevant authorities and the result of whether or not an agglomeration exists can be displayed within the application.
Data storage
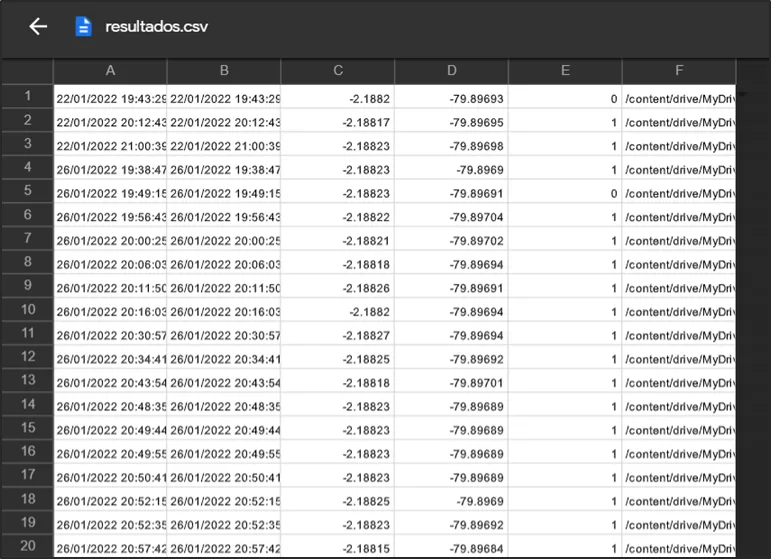
Once the prediction of the agglomeration of garbage within the application has been made, a database is created through the Google Drive application in .csv extension, where the following parameters are considered:
– Length
– Latitude
– Model prediction result
– ID of the captured image.
Below, you can see the final file generated with all the data you have collected:
Interface operation

BI tool
According to the results generated by the model and the data saved by the web application. We have considered for use in the market, ease of use, better visualization of objects and developing the dashboard in Power BI.
Power BI is a tool that is mainly used to create dashboards that facilitate decision making.
The information can be updated automatically or manually and allows the sharing of reports through the tool itself.
For all the aforementioned reasons, the use of said tool was carried out.
Data extraction
Once the web application saved the data, we performed the following steps shown in the following graph.
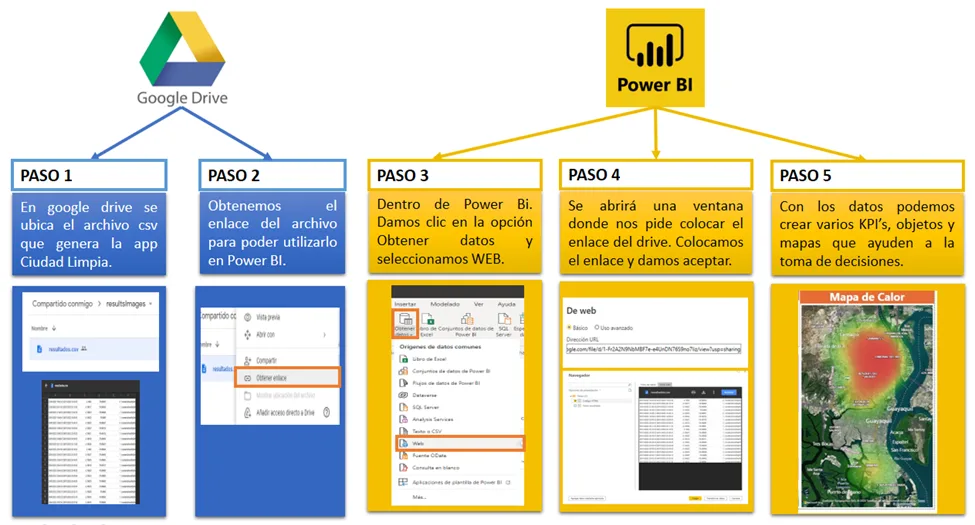
Figure 20.- data extraction steps
Using the fields: latitude, longitude, timestamp, agglomeration (1-Yes, 0-No). We create a dashboard that contains various objects such as KPIs, bar charts, pie charts and even maps. Thus visually have a better understanding of the results.
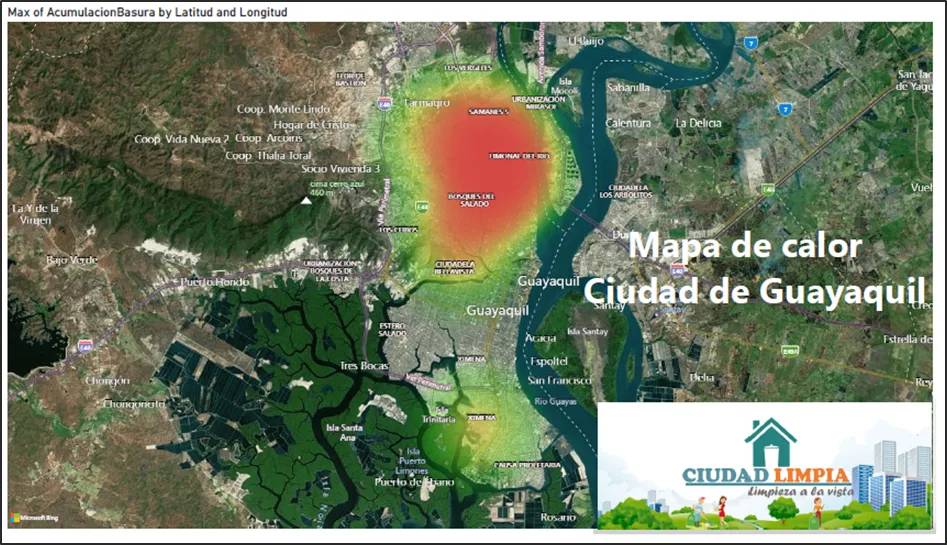
Figure 21.- Heat map of the city of Guayaquil
This information allows us to identify through a map in which points of the city we have the most garbage agglomerations, on what dates and days the greatest amount of agglomeration was identified and to make an improvement in terms of garbage collection.
Resources
- Garbage: Ecuador's red numbers. (2019, March 6). Plan V. https://www.planv.com.ec/historias/sociedad/basura-numeros-rojos-ecuador
- F., & de Franspg, V. T. L. E. (2020, September 20). Generation of artificial data (Data Augmentation).
-World Bank Group. (2019, March 6). Living with garbage: the future we don't want. World Bank. https://www.bancomundial.org/es/news/feature/2019/03/06/convivir-con-basura-el-futuro-que-no-queremos#:%7E:text=Se%20proyecta%20que%20la%20r%C3%A1pida,podr%C3%ADa%20ser%20la%20nueva%20normalidad.
Members
- Ingrid León A.
- Alessandra Palacios
- Manuel Ahumada
- Cesar Villarroet
- Patricia Andrade
- Ivan Ortiz
- Diana Lopez
- Diego Sanchez
Project presentation: DemoDay
Repository
The entire explanation regarding implementation, code, model training, use of interface and BI tool can be found in the following link:
https://github.com/SaturdaysAI/Projects/tree/master/LATAM_remote/ciudadlimpia
More artificial intelligence!
The mission of Saturdays.ai is to make artificial intelligence more accessible (#ai4all) through intensive courses and programs where projects for good are carried out (#ai4good).
If you want to learn more about artificial intelligence join our community at community.saturdays.ai or visit us on our website www.saturdays.ai Join us!
A history of the Saturdays.AI community. Originally published on March 9, 2022.
← More community stories