Discovering sleep quality with Machine Learning techniques
A project analyses pandemic sleep surveys with Random Forest and Gradient Boosting, explaining the results and their interpretation limits.
A learning project shared by the community. The article documents its team, methods and results; it does not establish that the prototype is ready for real-world use.

Latam online. Second Edition. 2021
The outbreak of COVID-19 and the societal responses adopted to combat its spread (e.g., lockdowns and social distancing) have had far-reaching consequences, but have also provided a unique opportunity to examine the effects that chronic stress and uncertainty can have on sleep patterns in the general population.
Stress and sleep are related, and disrupted sleep can accompany emotional difficulties. The cited meta-analysis of the COVID-19 pandemic(1) estimated a pooled prevalence of sleep problems of 32.3% in the general population, with variation between studies. This association does not by itself show that every case was caused by the pandemic.
It is known that in addition to stress due to the COVID-19 pandemic, there are other factors that could alter the resilience shown under stress, for example, lack of social interaction, lack of physical exercise, economic well-being, etc.
The project explores associations between sleep quality and personal and contextual variables during prolonged stress. Its aim is to generate questions and hypotheses for further study, not clinical advice based on the model.
Methodology
We used the Boston College sleep and wellbeing survey described by Cunningham and colleagues in 2021. The project initially worked with data from 1,518 participants recruited through social media, including variables such as age, economic circumstances, minority status and risk factors.
Once the database is selected, we continue to clean and process the data. After this process, the number of variables in our database was 216 and the sample size was reduced to 839 subjects because not all the information was complete.
The main variables include demographic information (age, gender identity, income, etc.), information related to sleep habits, anxiety levels, cognitive emotional regulation, and personality, among others.
We used the total Pittsburgh Sleep Quality Index (PSQI) score, which ranges from 0 to 21. Higher scores indicate poorer perceived sleep quality. This questionnaire measure does not replace clinical assessment.
Dataset analysis
We observe the distribution of the data
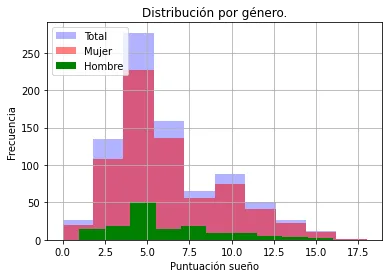
Sleep score
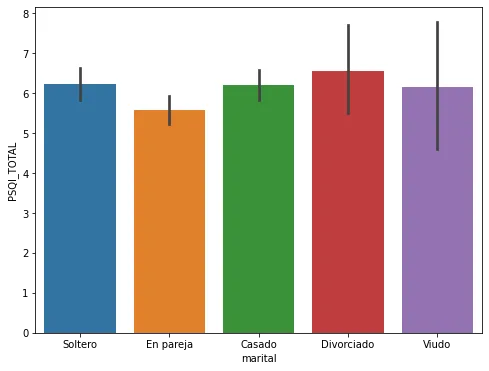
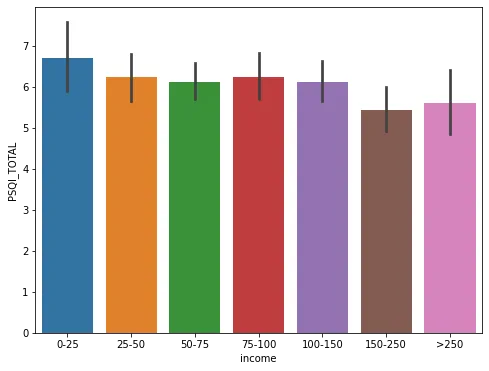
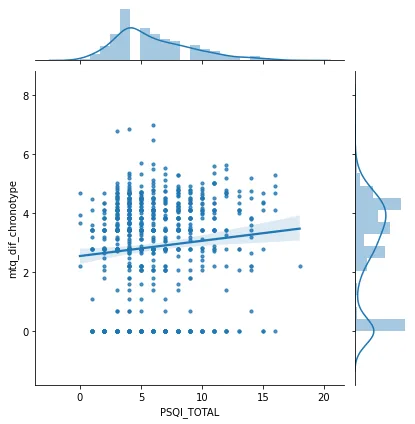
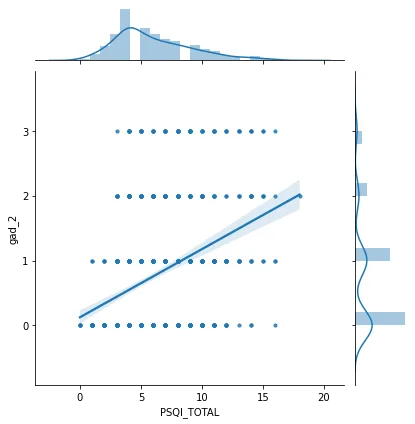
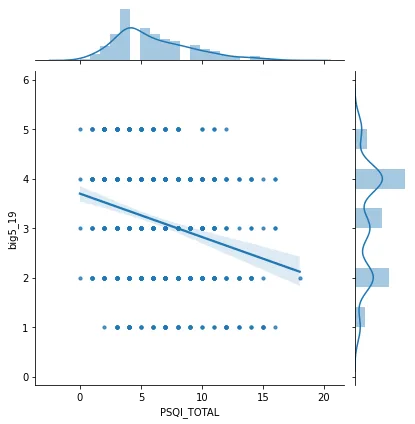
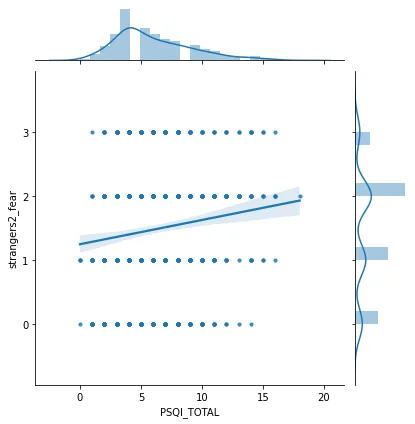
We explored correlations between the sleep score and other variables:
- Chronotype difference before and during the pandemic
- Anxiety variable (Can't stop worrying)
- Personality variable (Considered relaxed)
- Social anxiety variable (Fear of strangers post covid)
Models
Classification
In the data set, our chosen metric for evaluation takes values from 0 to 18 (no cases from 19 to 21 have been observed). If we take these values as if they were classes or subsets we can apply a classification method.
RandomForestClassifier initially achieved a score near 0.20. Grouping values into fewer classes raised it to around 0.5 for six classes and 0.7 for four. These are different classification tasks, so the figures are not directly comparable improvements on the same problem.
To have an explanation of these results we show the shap values of the predictions:
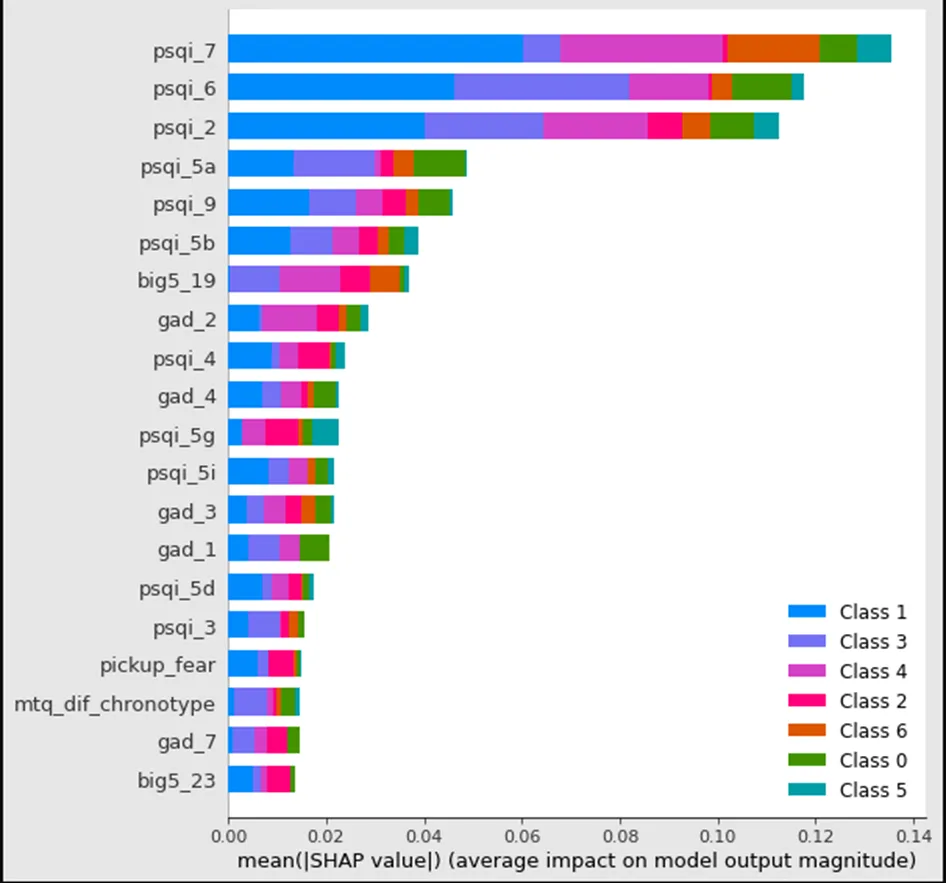
We can observe that the variables that appear with the most weight are those that are directly linked to sleep data (psqi_*). The first of all are whether the person has resorted to sleeping medicines, their self-reported perception of their sleep quality, and the time it takes to fall asleep. Within these variables we also observe that personality data (big5_*) has an impact, such as whether one considers oneself a relaxed person, or anxiety (gad_*), such as the ability to let go of worries.
It is unsurprising that PSQI questionnaire variables have high importance, but this limits interpretation: using components of the index to predict its total may simply reconstruct the score. Studying external factors would require excluding those components and evaluating again. The sample is also small for distinguishing so many classes.
Regression
To estimate the score, we explored Random Forest, Gradient Boosting and HistGradientBoosting. The original list also included logistic regression, which is a classification method rather than regression for a continuous score.
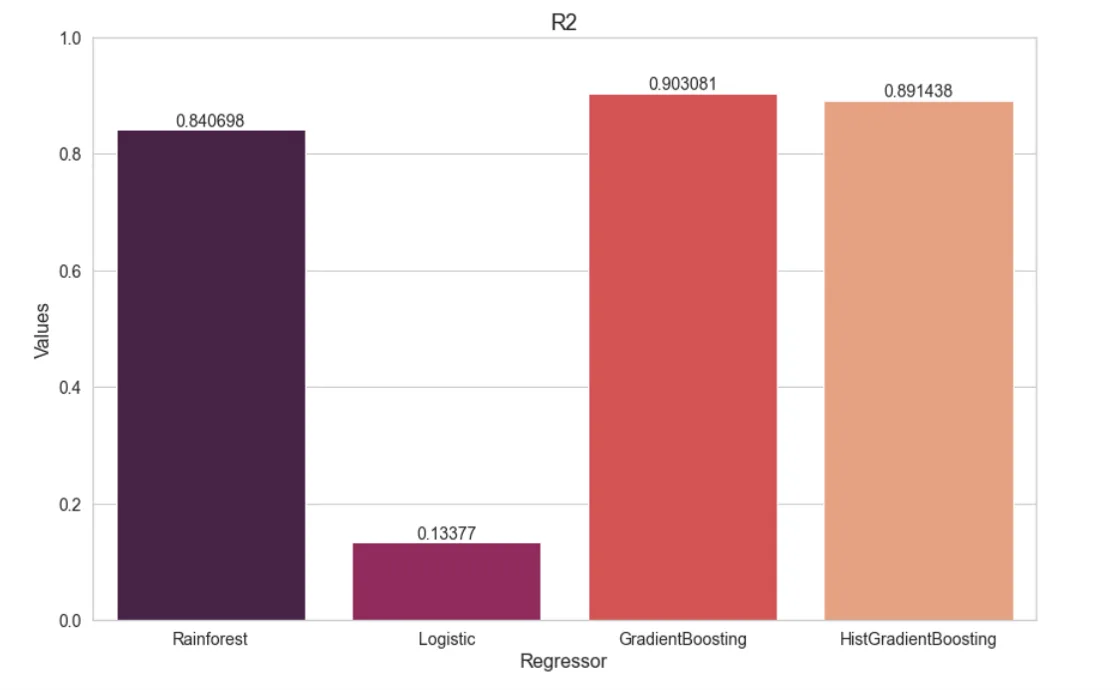
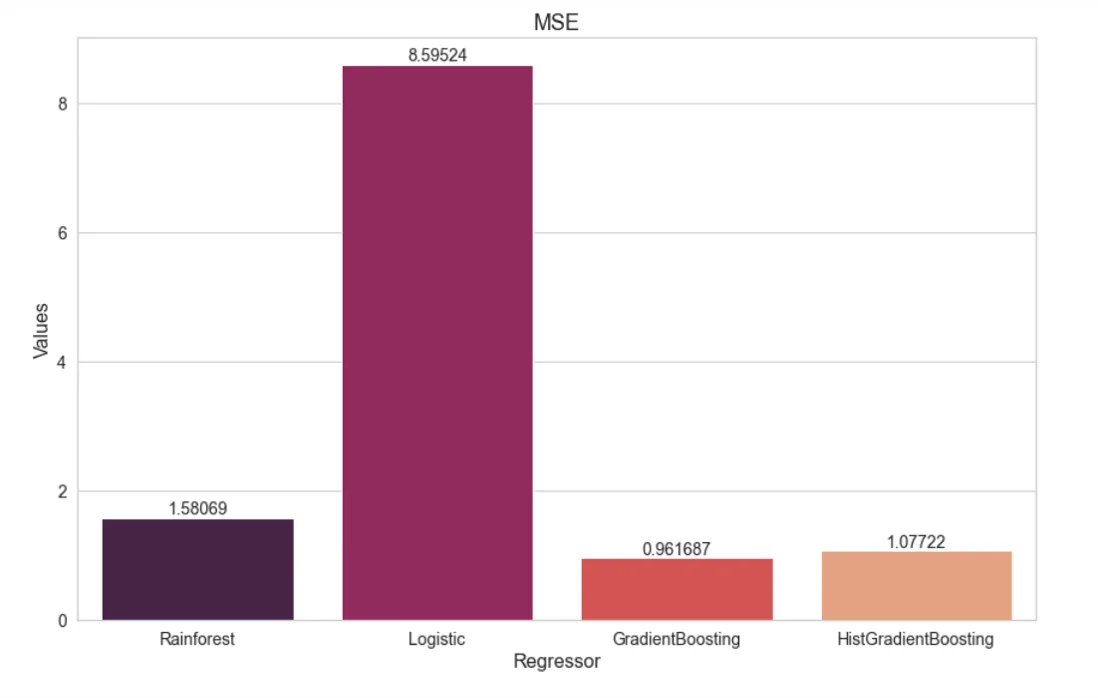
Gradient Boosting achieved the highest reported coefficient of determination, R² = 0.9. This summarises explained variance relative to a constant baseline prediction; it does not mean that 90% of points lie on a line or that 90% of predictions are correct.
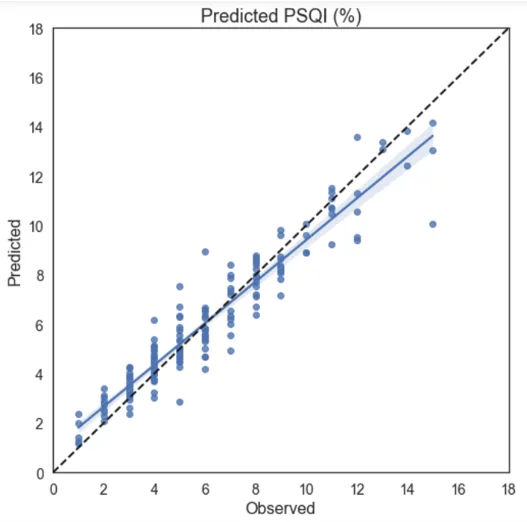
We tried hyperparameter search with RandomizedSearchCV without improving the result. We also reduced the inputs to 138 PCA components, but R² fell to 0.57.
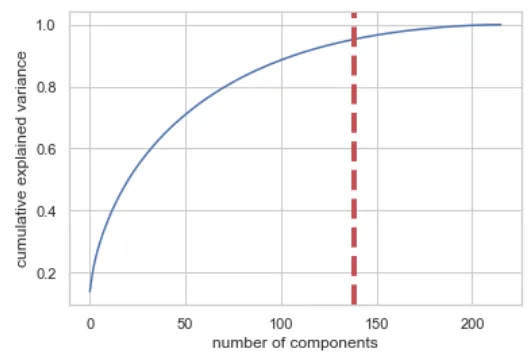
PCA analysis to reduce the number of variables
For this reason we decided to stick with the result obtained with the GradientBooster algorithm as the best option to predict sleep quality.
Conclusion
The R² result of 0.9 must be read with the limitations above, particularly the inclusion of variables that form part of the index itself. Variables highlighted by the model included:
- Medication
- Time it takes for a person to fall asleep
- Enthusiasm for doing things
- Stress management
- Controlling worries
These associations may guide further research, but they do not establish causes of poor sleep or justify prescribed interventions. Model inputs and generalisation would need further evaluation first.
Next steps would include expanding the sample, checking for information leakage and evaluating on independent data.
References
1. Jahrami, H. et al. Sleep problems during COVID-19 pandemic by population: a systematic review and meta-analysis. J Clin Sleep Med, jcsm-8930. (2020).
2. Cunningham, T.J., Fields, E.C. & Kensinger, E.A. (2021) Boston College daily sleep and well-being survey data during early phase of the COVID-19 pandemic. Sci Data 8, 110. https://www.nature.com/articles/s41597-021-00886-y
Members
- Ana Galindo Alonso
- Bianey Palma
Project presentation: DemoDay
More Artificial Intelligence!
Saturdays.AI makes AI more accessible through shared learning and projects with a social purpose. Our motto is AI4ALL IS AI4GOOD.
A story from the Saturdays.AI community. Originally published on March 9, 2022.
← More community stories